Tables
How to add and format tables in your deliverable.
Examples
Follow along with the out-of-the-box example code below.
Tables are an important part of business deliverables, helping organize data clearly for the reader. In t0, you can insert tables manually or generate them automatically based on the information collected during earlier workflow steps. Both methods ensure your tables are formatted professionally and are easy to read.
Insert a table manually
Sometimes you may want to insert a quick table directly into your deliverable.
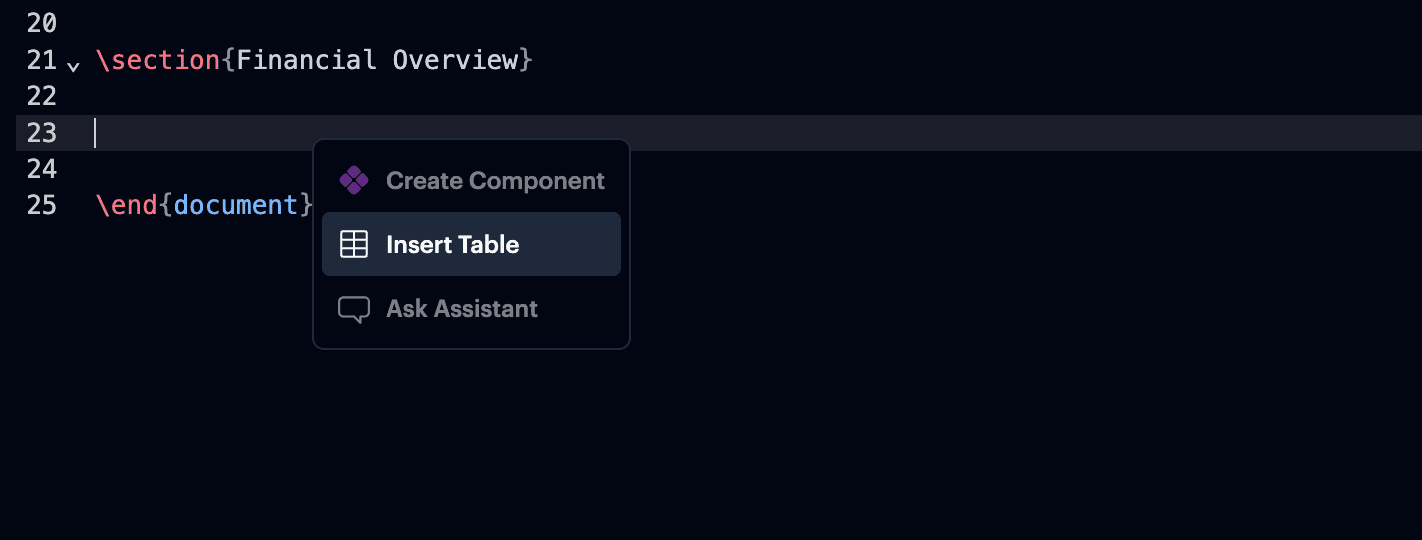
In t0, you can right-click into your LaTeX editor area and select Insert Table to add a ready-to-edit table.
Screenshot:
(Right-click menu shows: Insert Table)
This creates a basic table structure for you, using professional formatting packages already included:
booktabs(for better horizontal lines)tabularx(for automatic column width adjustment)adjustbox(for responsive sizing)
Example LaTeX for a manually inserted table:
Insert a table from your information request or analysis
When you collect data through an information request or during an analysis step in t0, you can automatically insert a fully populated table based on that data.
This ensures that your deliverable is fully synchronized with your client's responses and analysis work.
After completing an information request or analysis step
In the report section of the agent right-click → Insert Table
Select the specific data set (e.g., "Financial Data Table")
The table appears fully populated in your LaTeX file