Visualize intelligence
Box plot
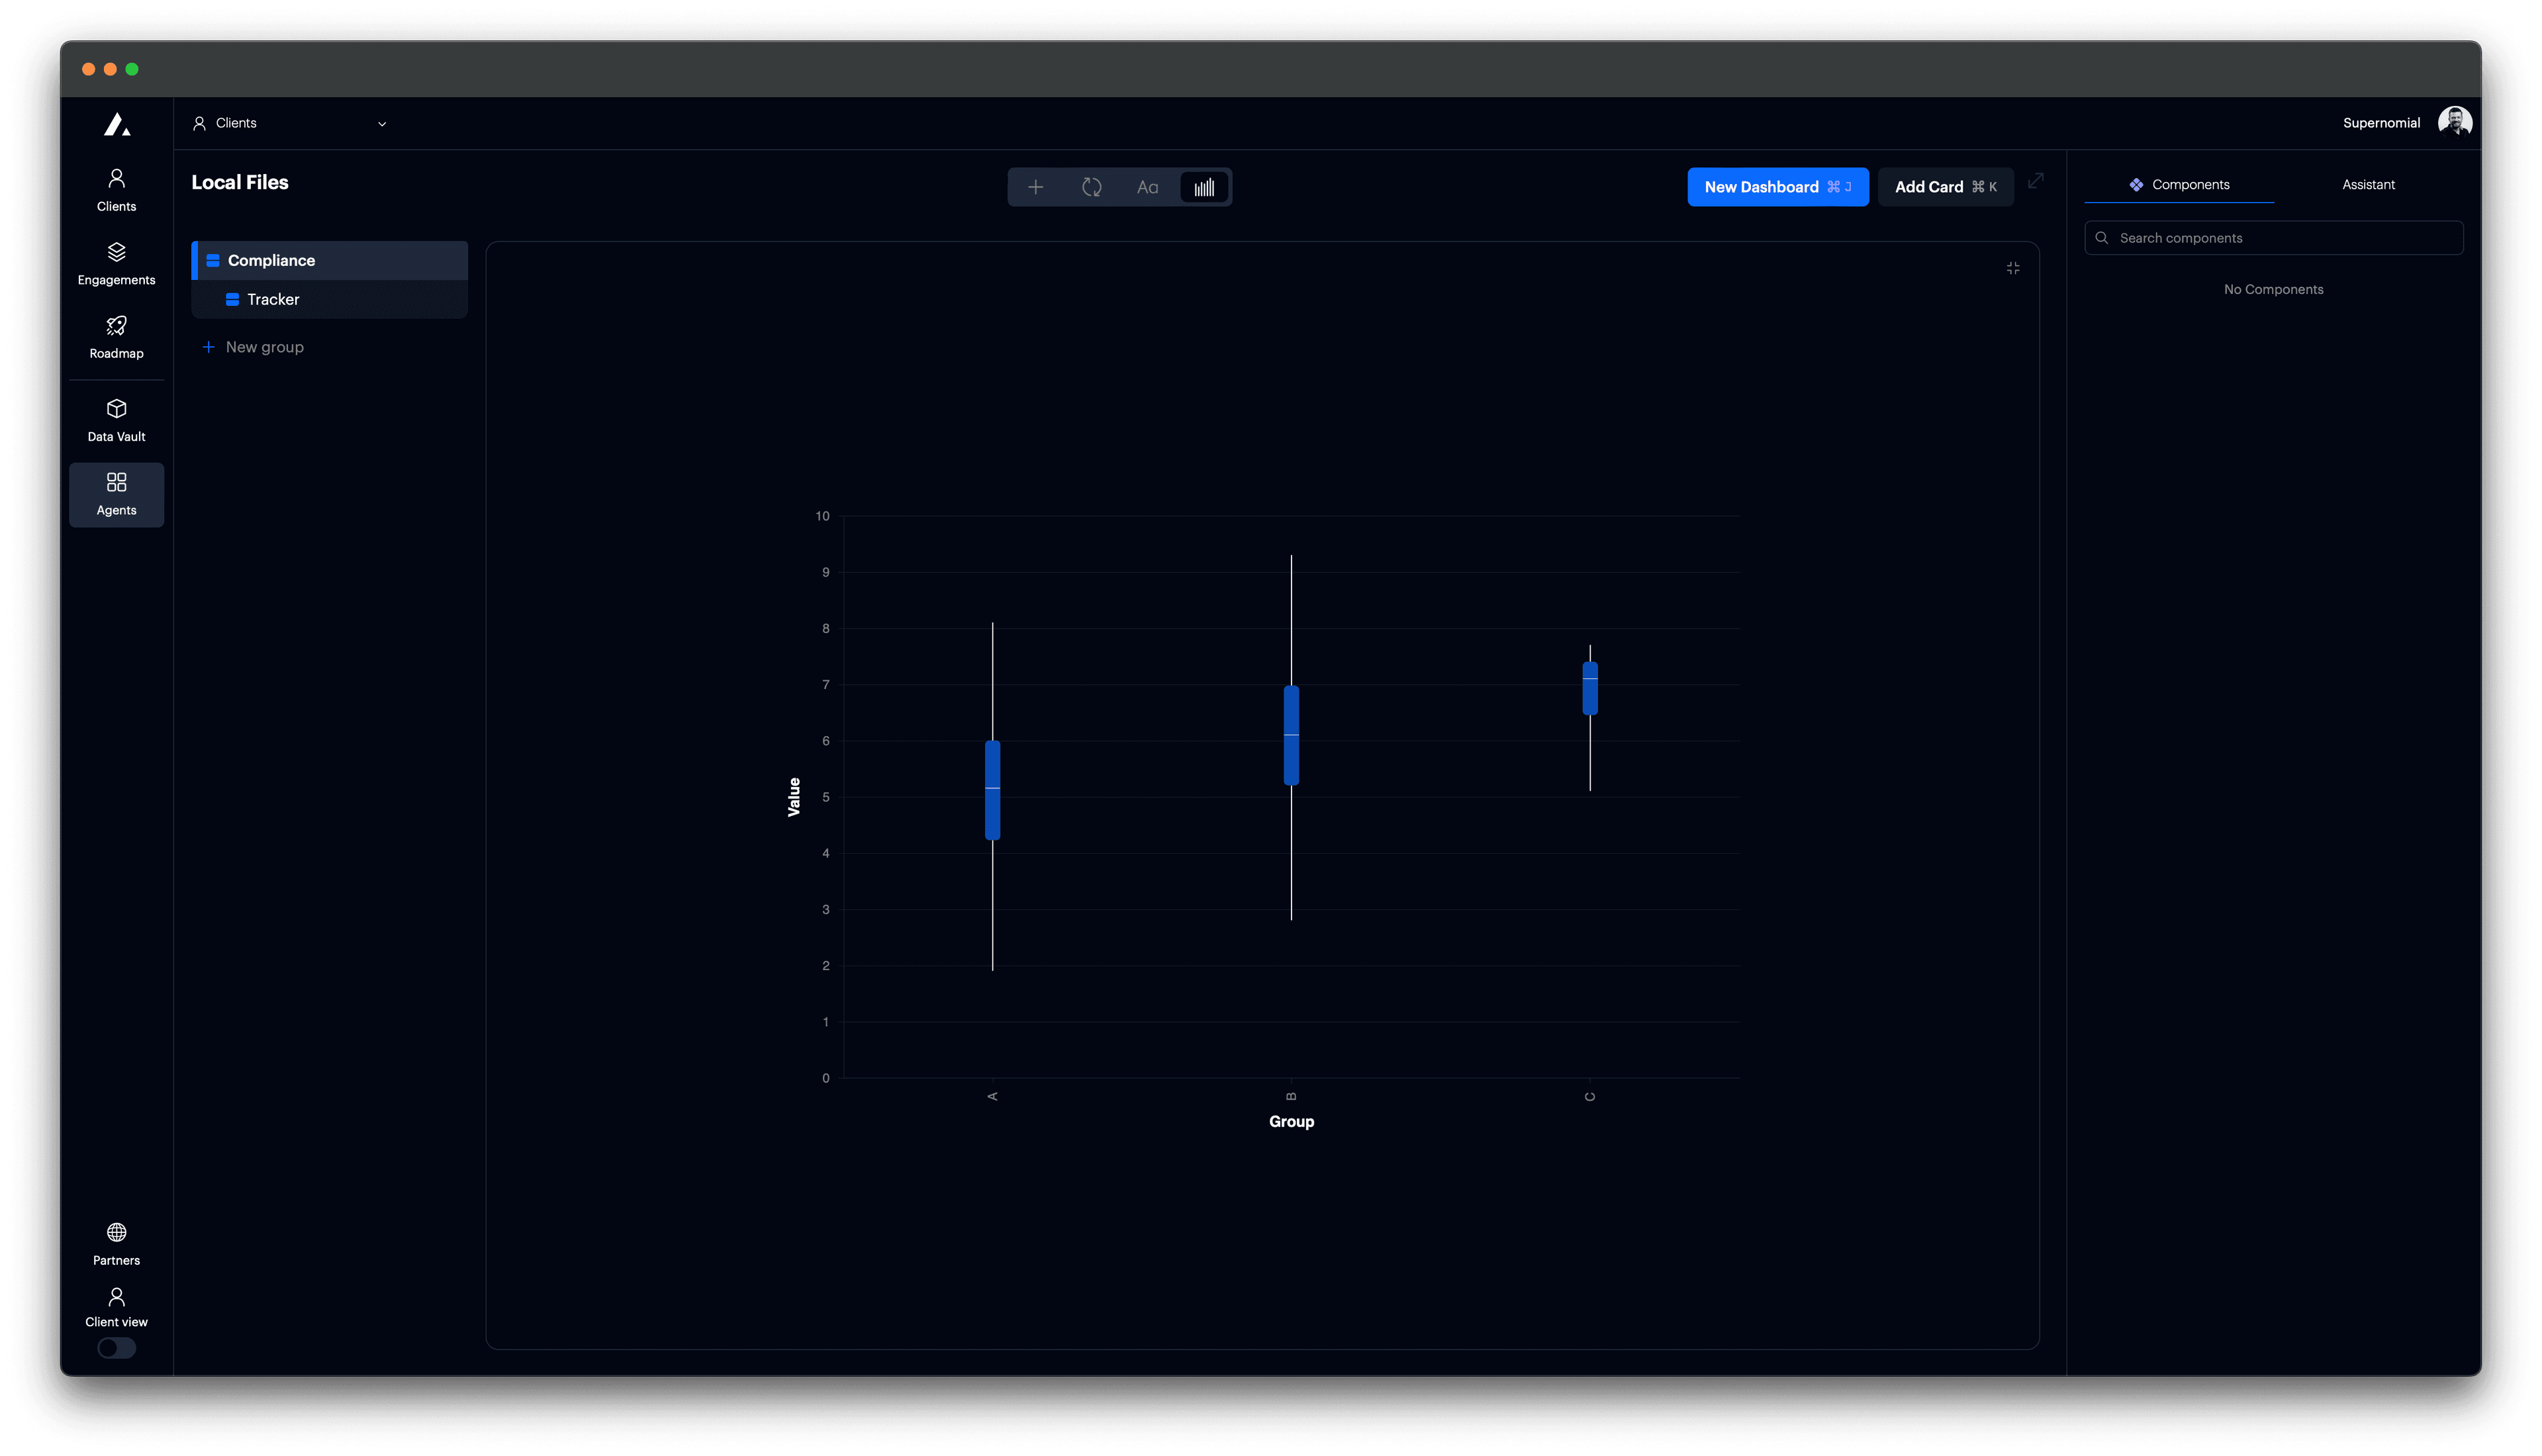
Add a box plot to a card.
Box plots show the distribution, median, and variability of a dataset. Use them to compare spread and detect outliers across groups.
Add box plot
Set card to type "Vega Chart".

t0 Prompt
Select data in the context dropdown of the chat window.
make a box plot
show distribution per group
compare spread across categories
Code
Configuration options
| Property | Description |
|---|---|
mark | Set to "boxplot" to enable Vega-Lite's composite box plot rendering. |
x | Categorical variable to group data by. |
y | Numerical field to visualize distribution and summary stats. |
tooltip | Shows values for group and value on hover. |
view.stroke | Removes the outer chart border. |
autosize | Ensures the chart fits inside its container. |