Visualize intelligence
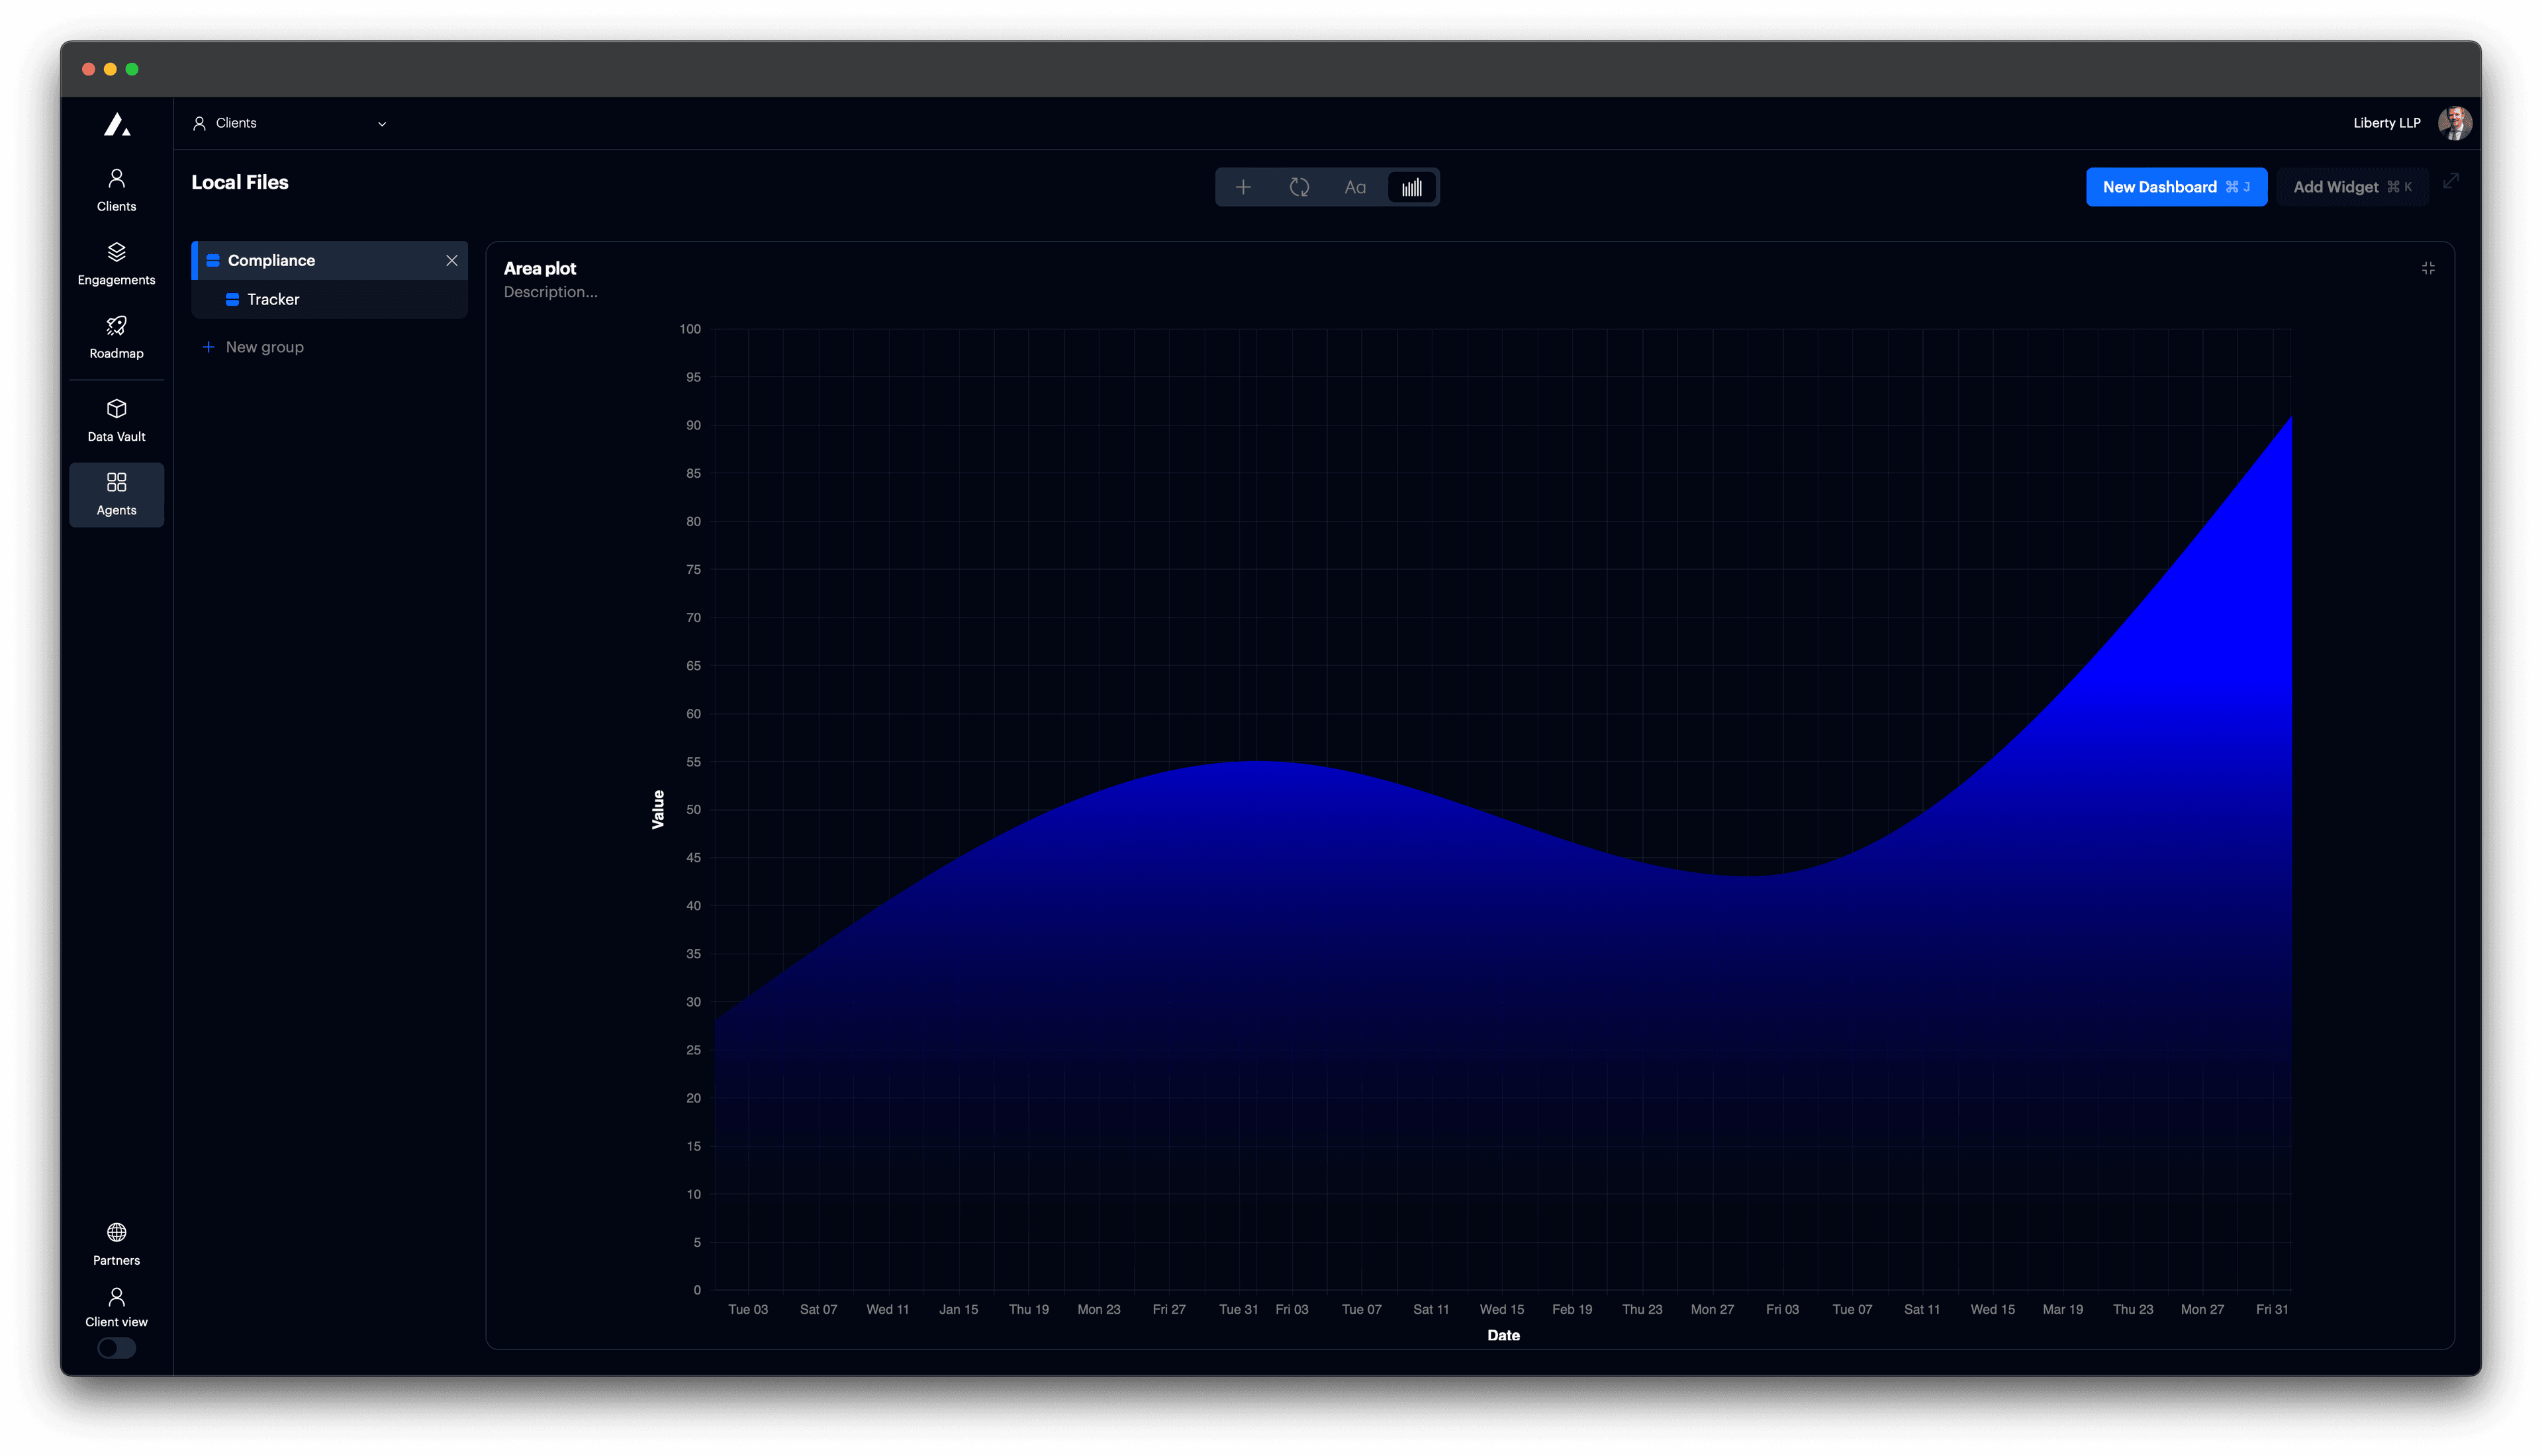
Area plot
Add an area plot to a card.
Area plots are useful for showing how values change over time, while also emphasizing the magnitude of those values. Use them when you want to highlight volume, accumulation, or gaps between values.
Add area plot
Set card to type "Vega Chart".

t0 Prompt
Select data in the context dropdown of the chat window.
make an area chart
show filled line
convert to area plot
Code
Configuration options
| Property | Description |
|---|---|
mark | Use "area" to fill space below the line. |
interpolate | (Optional) Smooths or steps the area shape ("linear", "monotone", etc.). |
x | Horizontal axis, typically temporal for time. |
y | Vertical axis showing magnitude. |
tooltip | Shows values on hover. |
autosize | Ensures the chart fits inside its container. |
view.stroke | Removes chart border for a cleaner look. |