Visualize intelligence
Filters
Add an interactive filter to control what's shown in a chart.
Filters let users interact with a chart by selecting specific values or ranges. Use them to explore different subsets of the data without editing the chart structure.
Add a filter
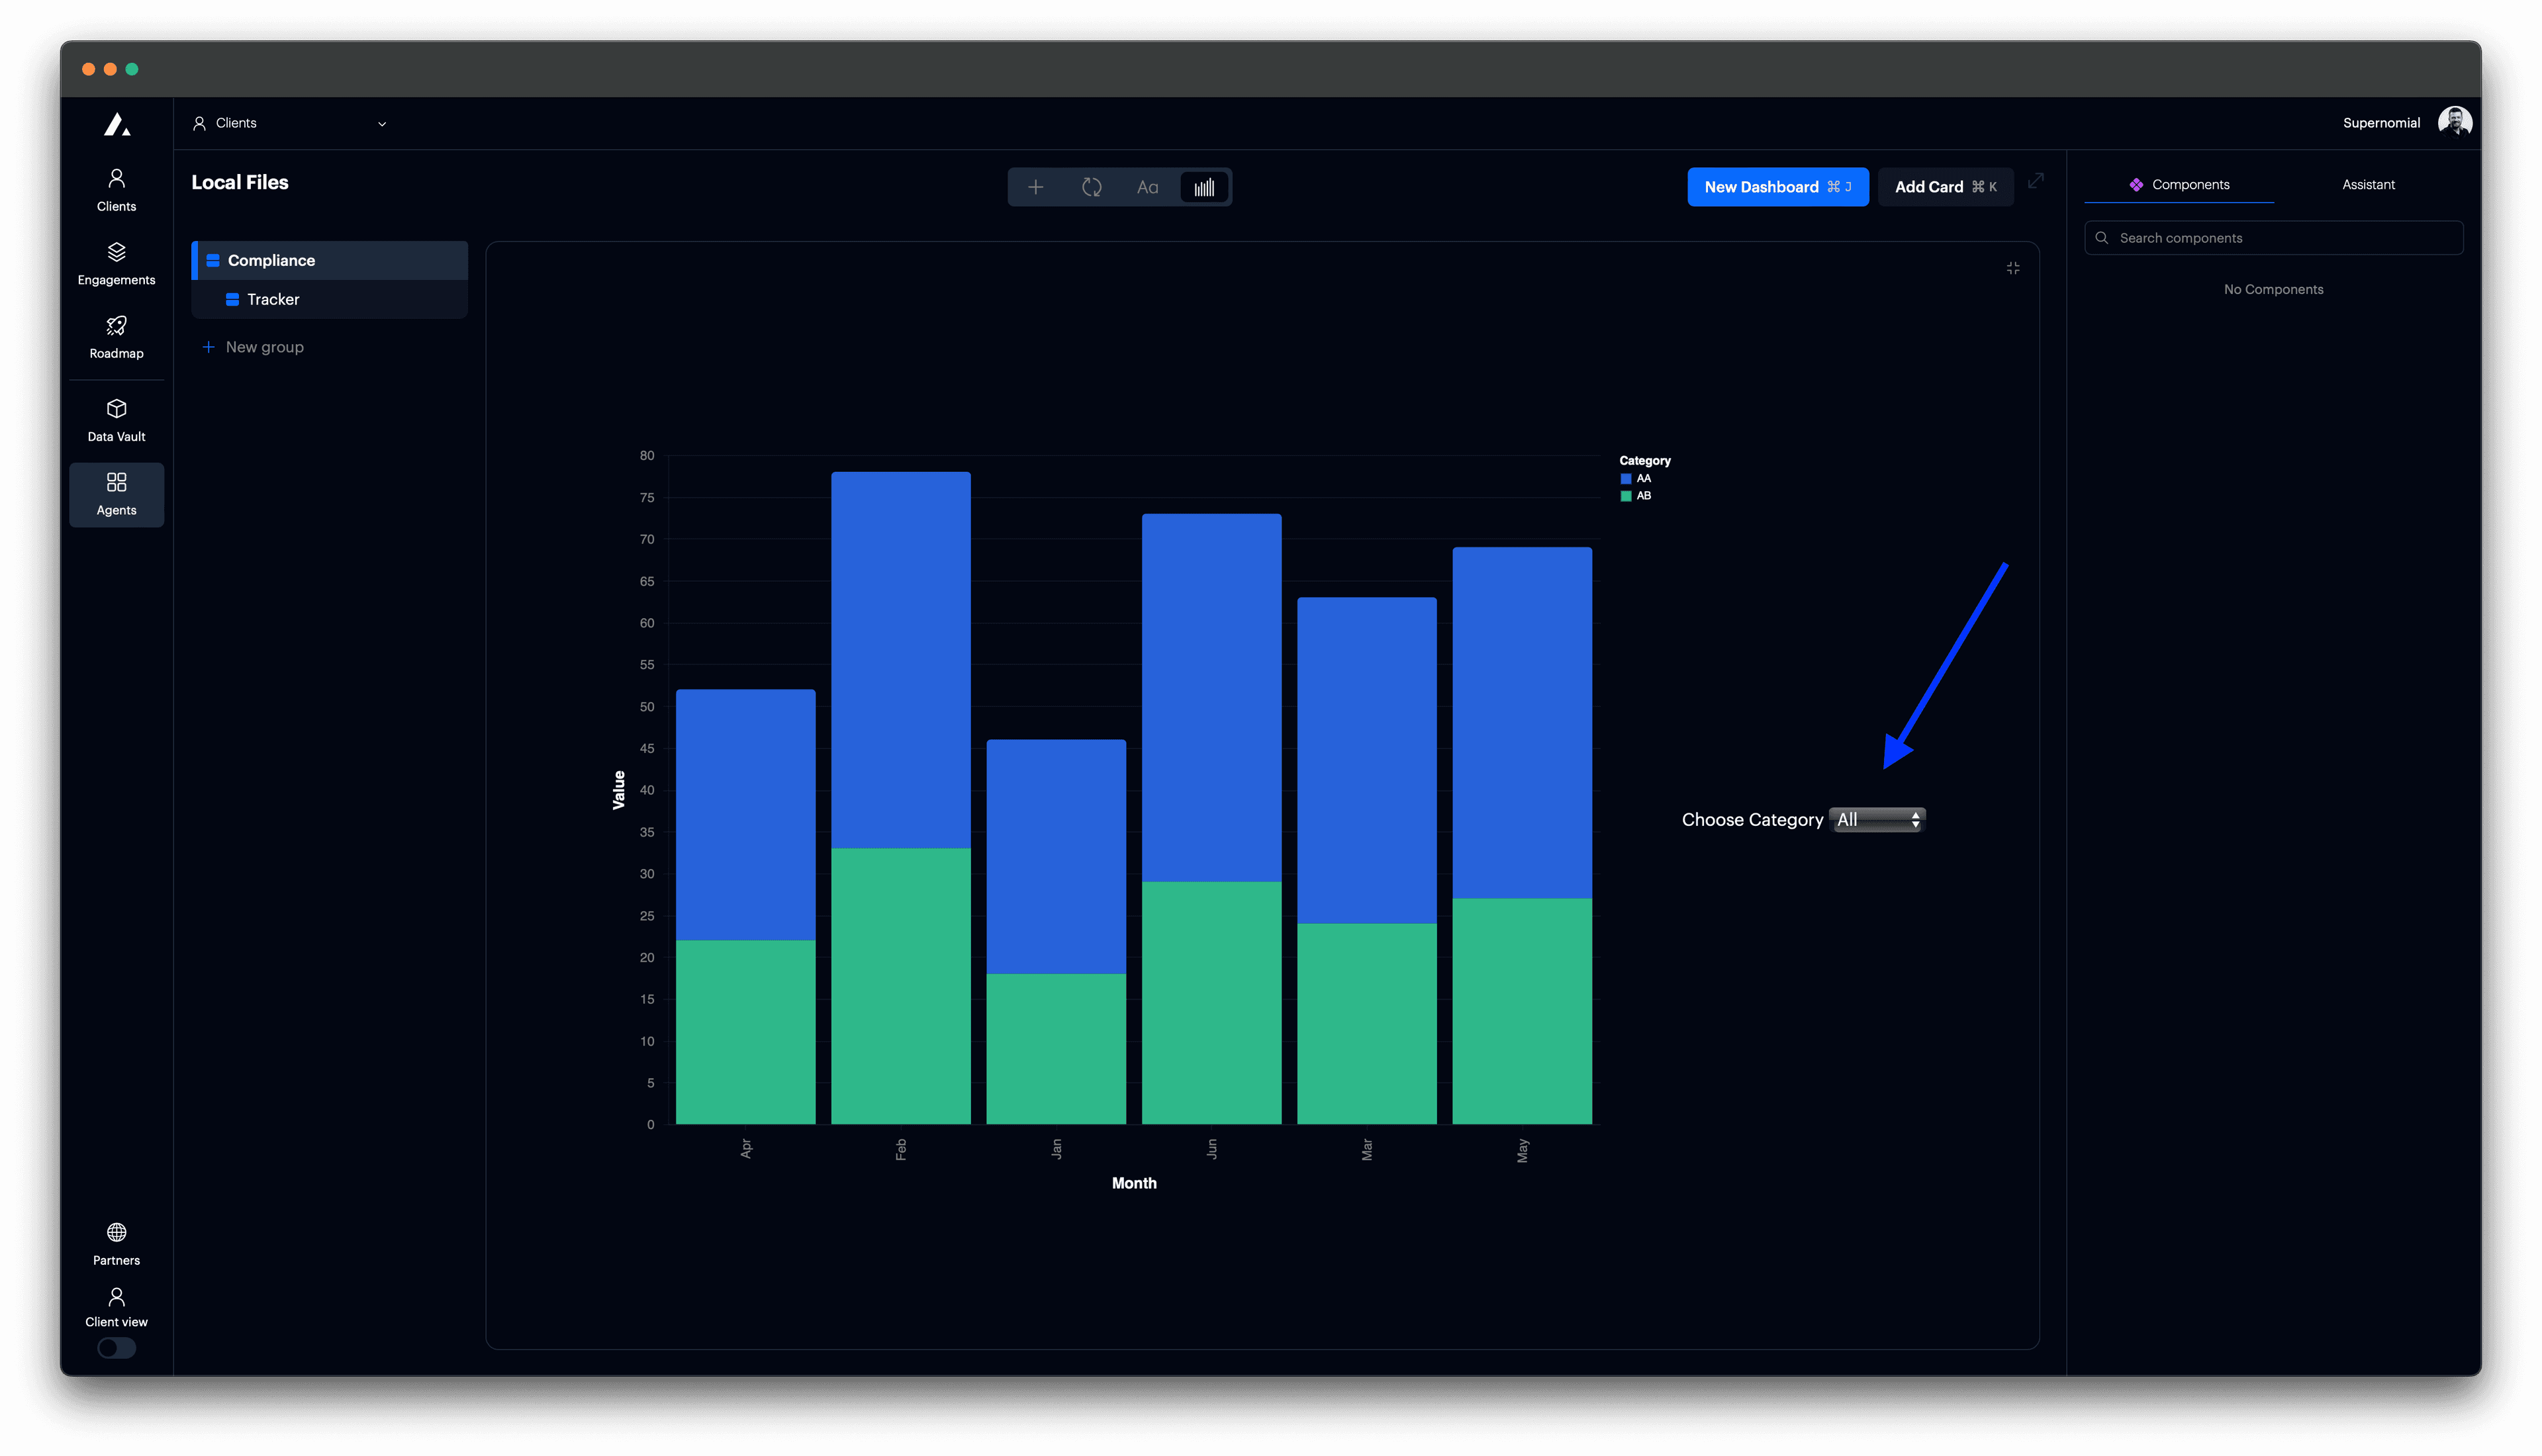
This example uses a dropdown filter to toggle which category (AA, AB, or both) is visible in a grouped bar chart.
t0 Prompt
Select data in the context dropdown of the chat window.
add a dropdown to filter category
toggle between AA, AB, and all
show bar chart by selection
Code
Configuration options
| Property | Description |
|---|---|
params.name | Signal name used in filters and expressions. |
bind.input | Sets the input type (e.g., "select" for dropdown). |
bind.name | Optional label above the dropdown. Set to "" to hide completely. |
bind.options | Values available to select. |
bind.labels | Human-friendly display text for each option. |
value | Initial selection value when the chart loads. |
transform.filter | Filter logic using the selected signal. |
view.stroke | Removes border from the chart area. |
autosize | Ensures the chart fits responsively in the container. |