Visualize intelligence
Tooltips
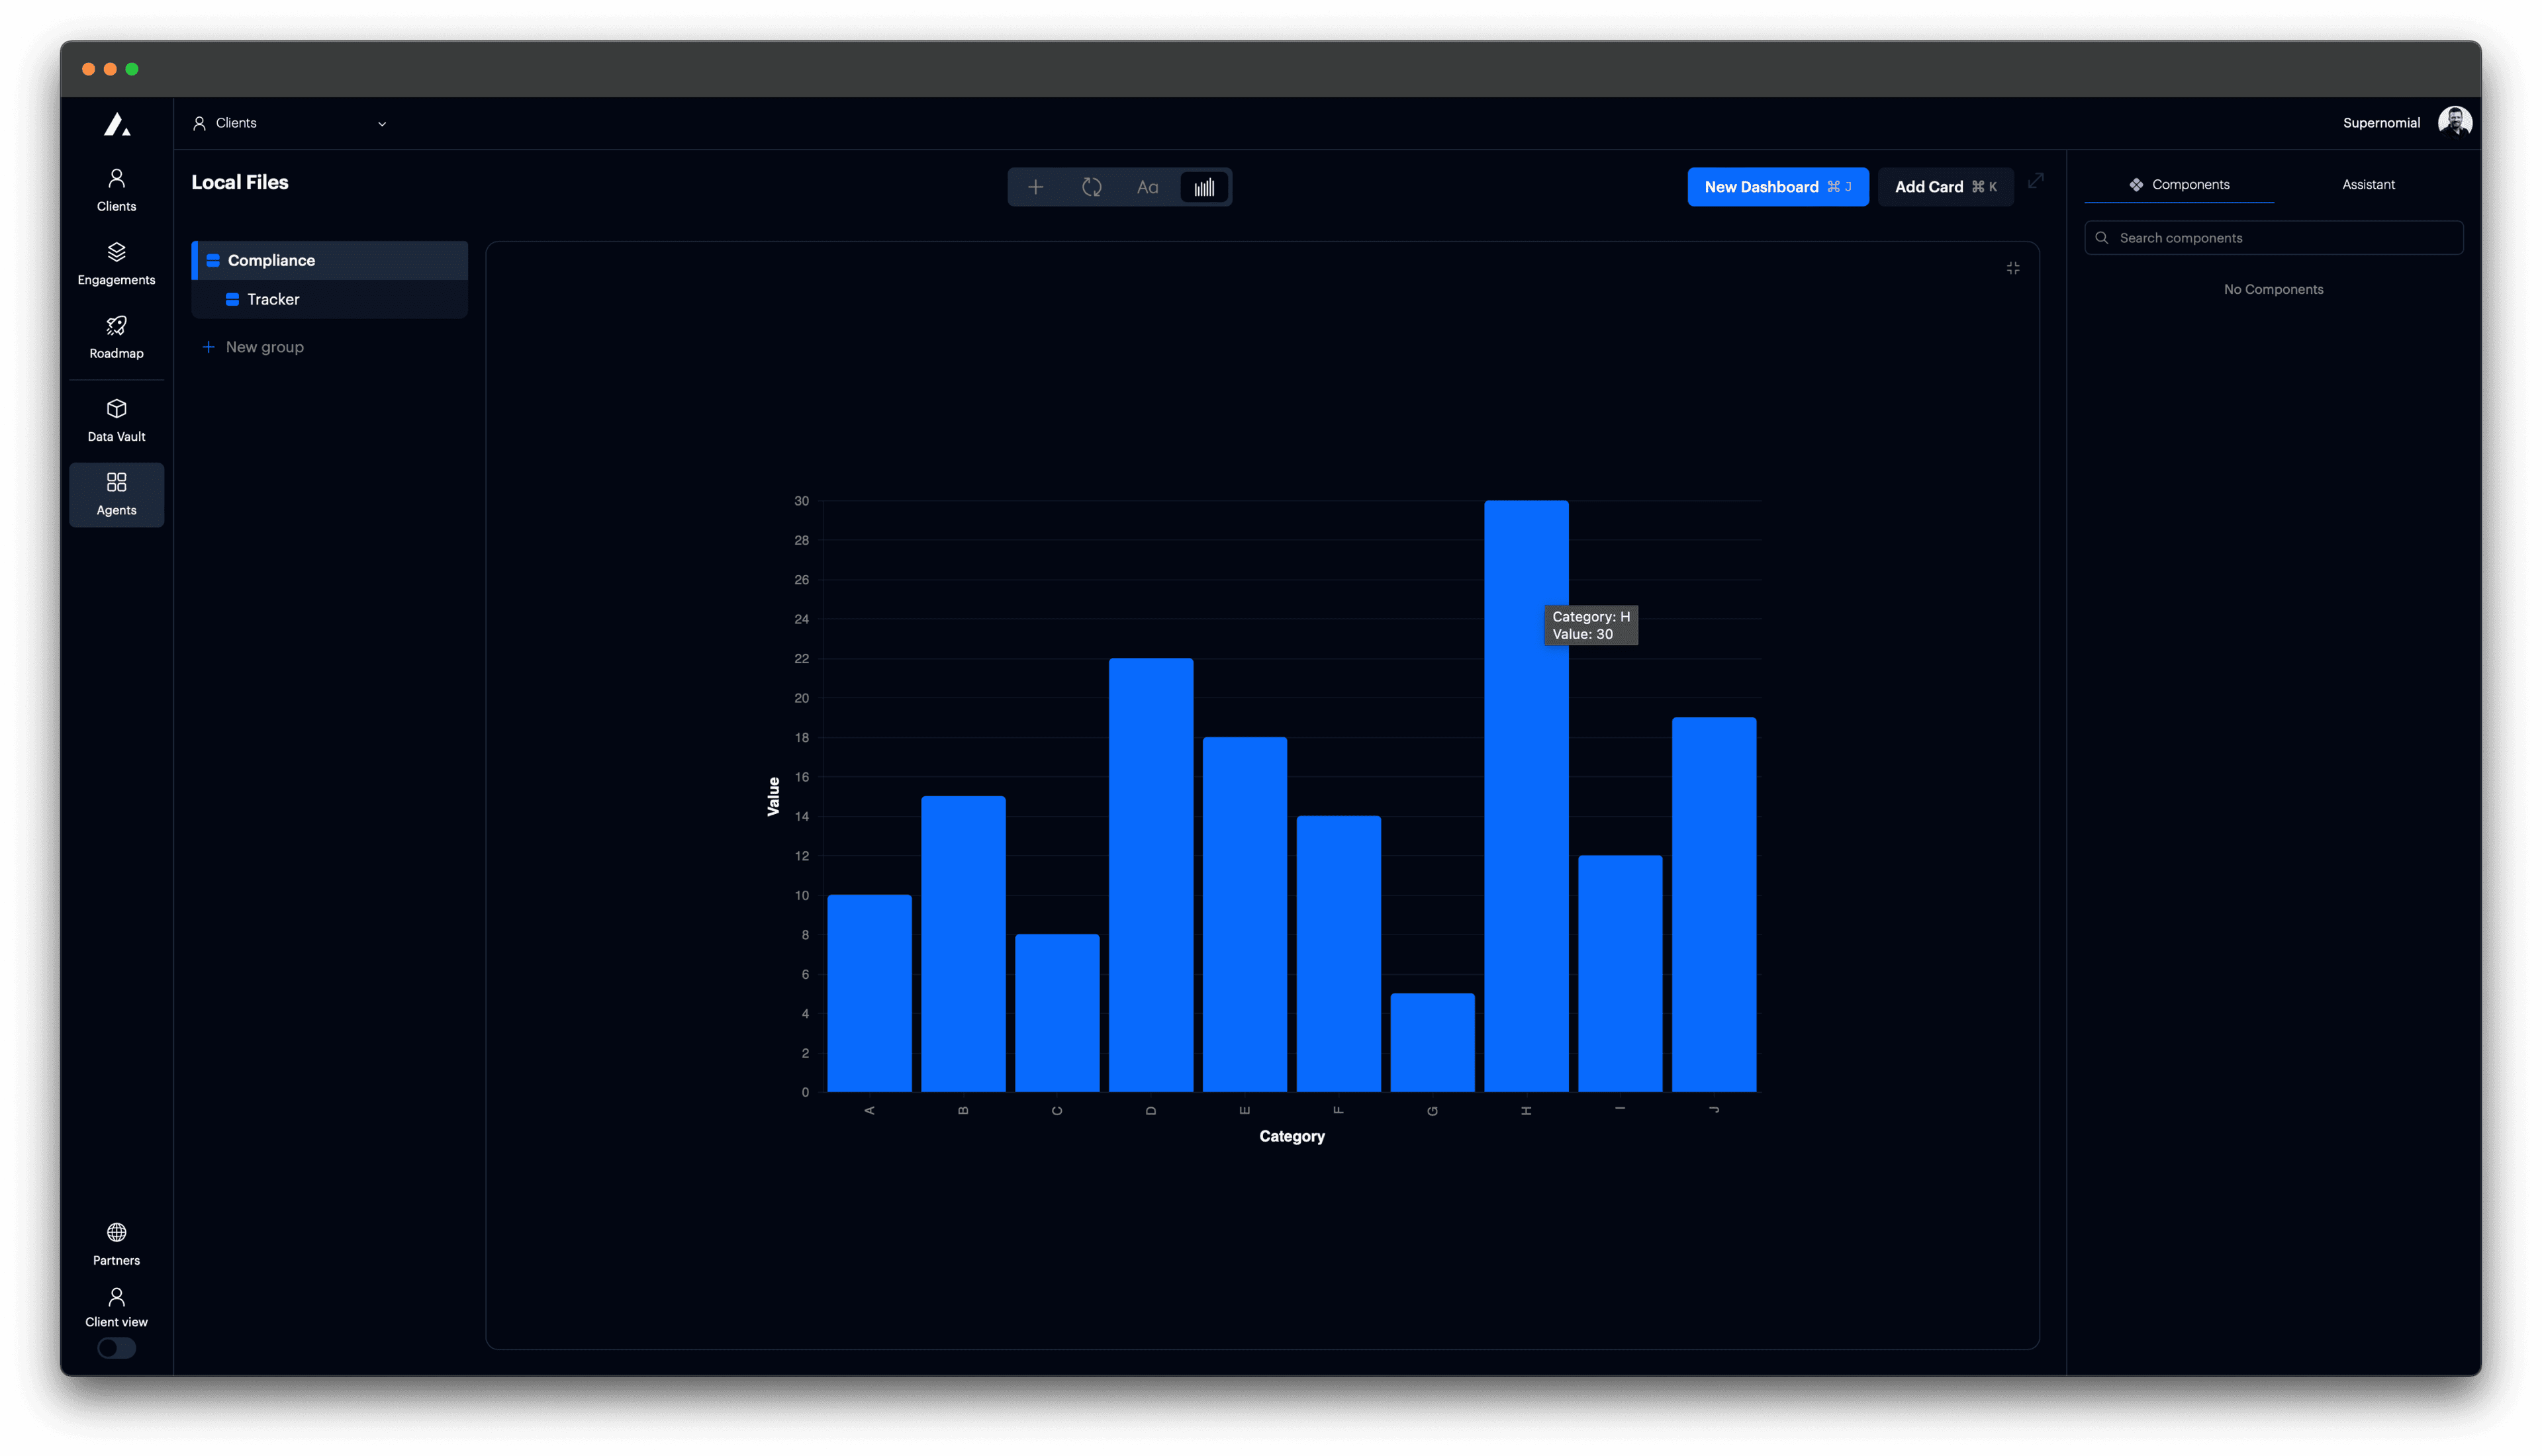
Add a tooltip to display additional information on hover.
Tooltips display contextual details when a user hovers over a chart element. They are useful for showing precise values, category labels, or any additional metadata without crowding the visual.
Add tooltips to a chart
You can add tooltips to any mark in Vega-Lite by using the tooltip encoding channel. Tooltips support one or more fields and automatically follow formatting based on field type.
t0 Prompt
Select data in the context dropdown of the chat window.
make a bar chart with tooltips
show value and category on hover
add hover labels
Code
Configuration options
| Property | Description |
|---|---|
tooltip | Defines the fields shown in the tooltip. |
field | Specifies the data field to show. |
type | Ensures correct formatting: use quantitative, nominal, or temporal. |
title | (Optional) Overrides default tooltip field name. |
autosize | Ensures the chart fits inside its container. |
view.stroke | Removes outer border for cleaner display. |