Visualize intelligence
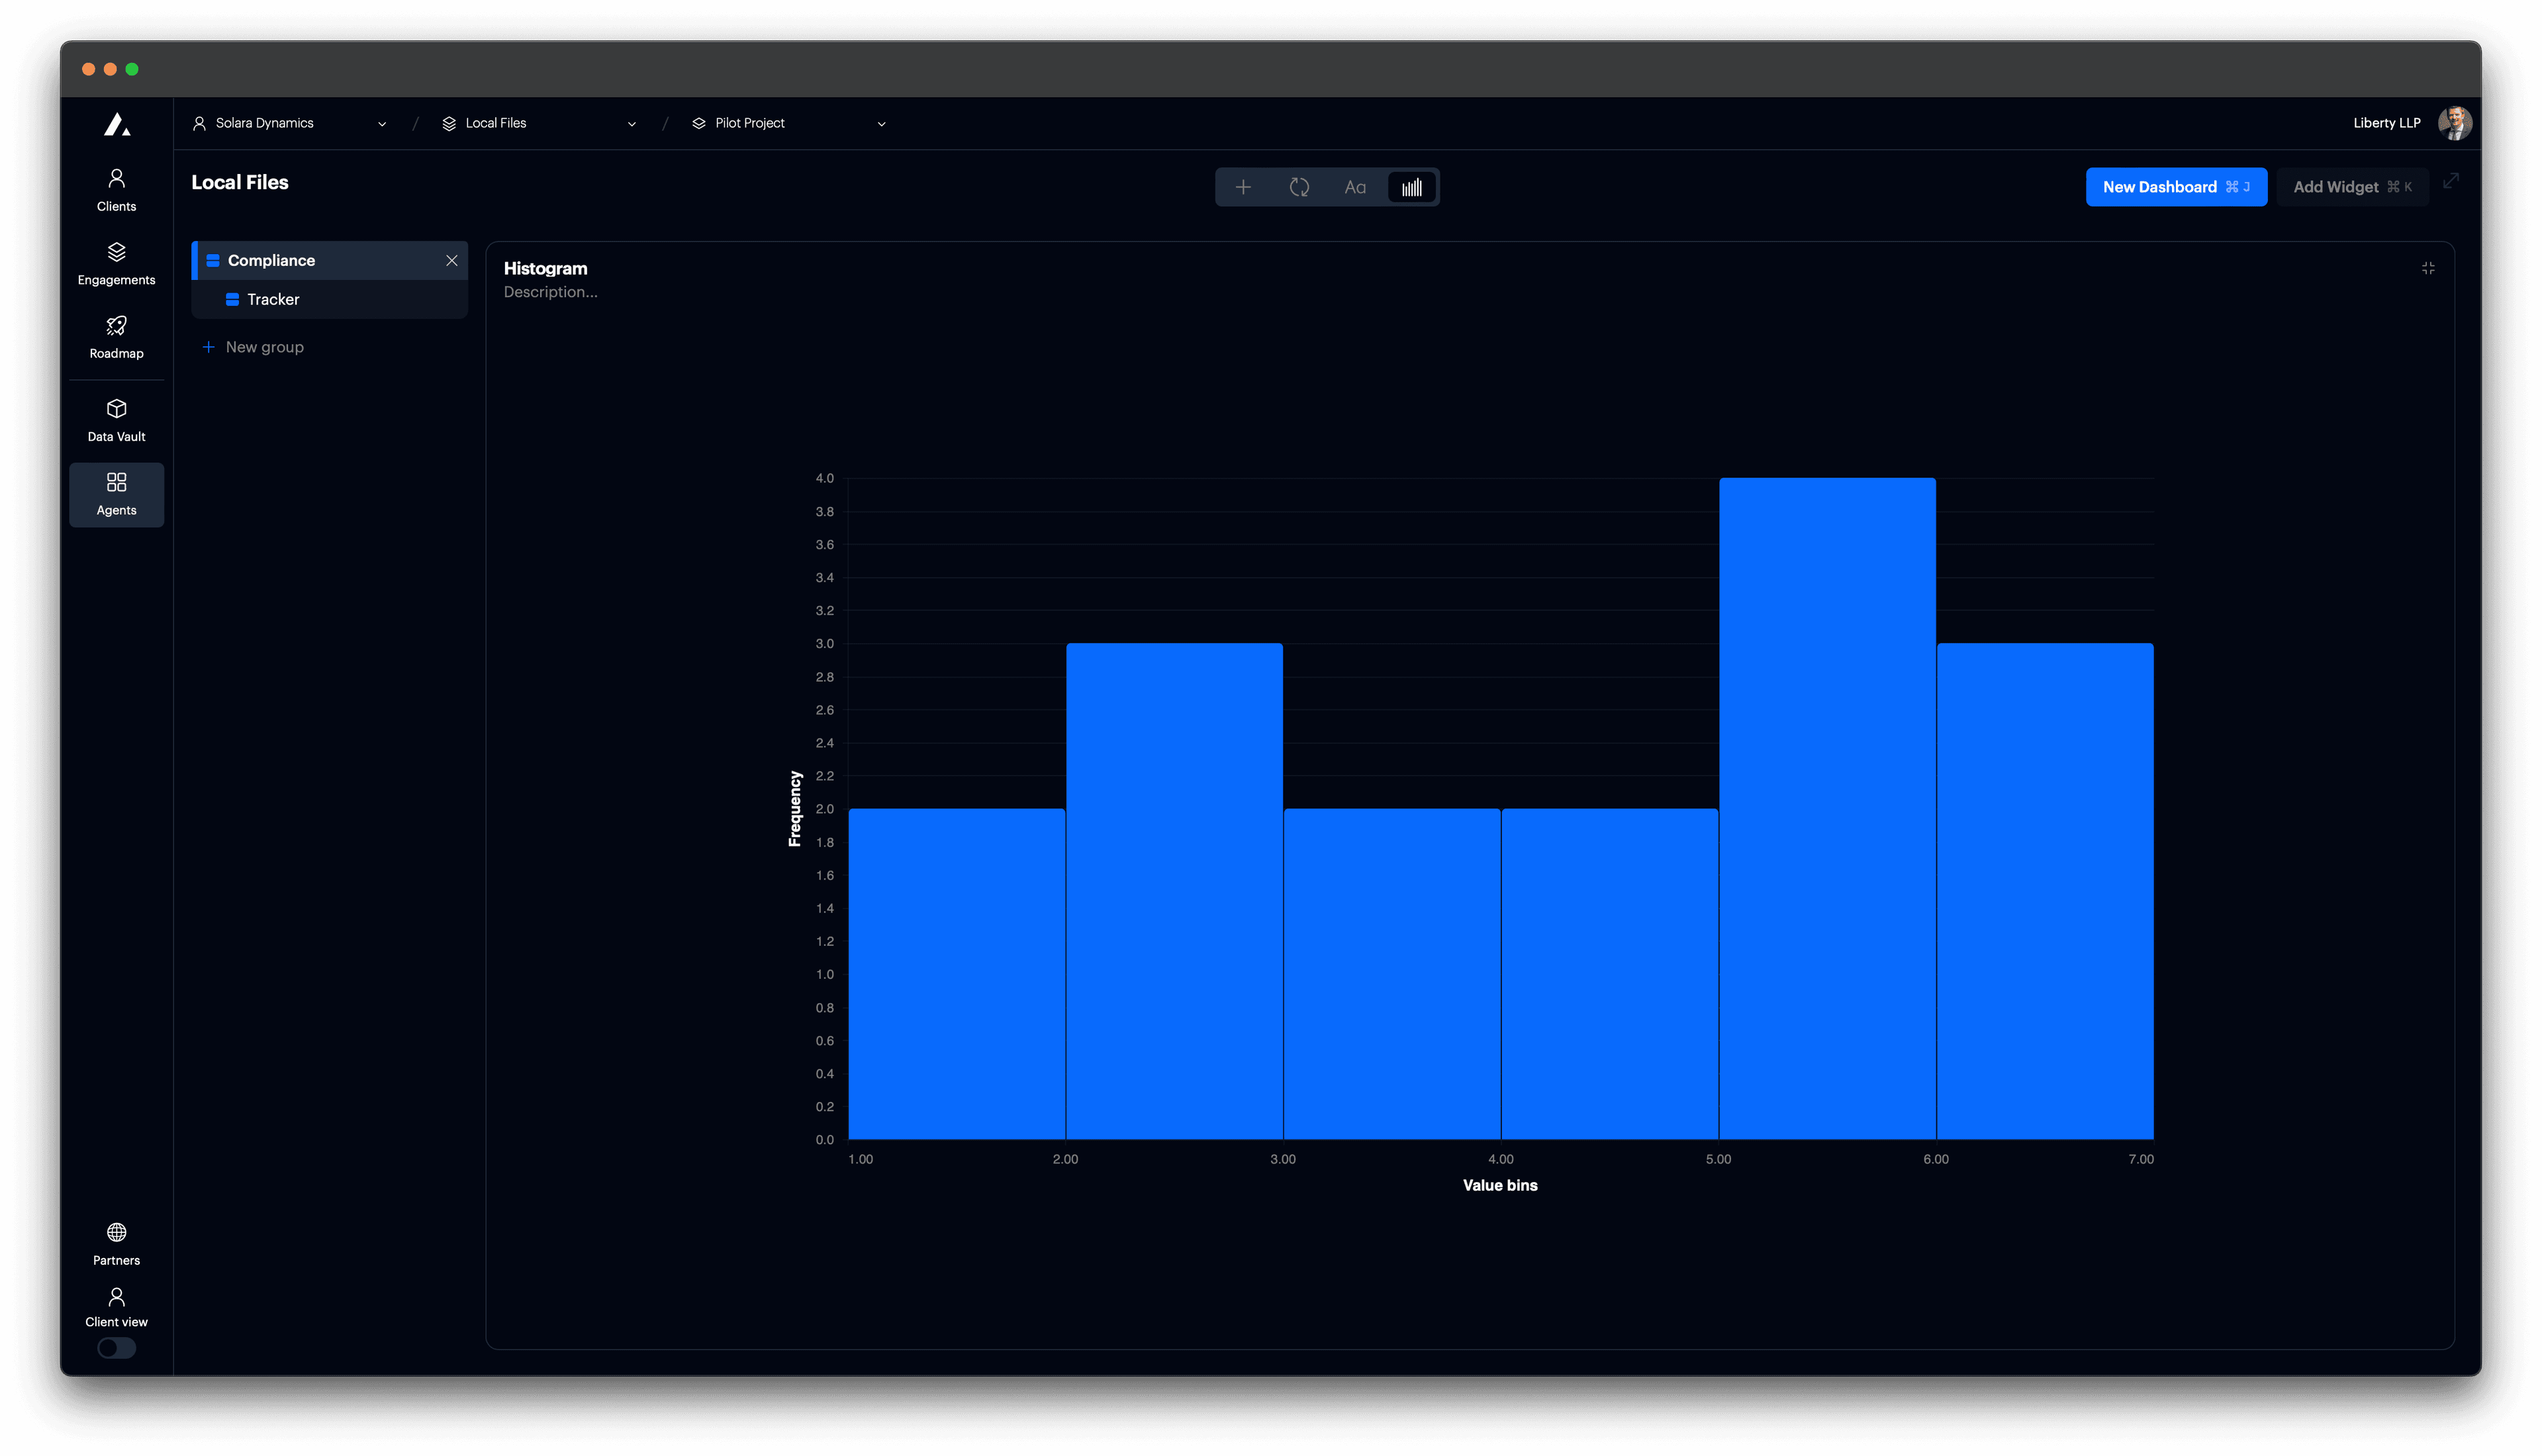
Histogram
Add a histogram to a card.
Histograms are used to show the distribution of a single numerical variable. Use them to understand the frequency of values across continuous intervals (bins).
Add histogram
Set card to type "Vega Chart".

t0 Prompt
Select data in the context dropdown of the chat window.
make a histogram
show distribution
plot frequency of values
Code
Configuration options
| Property | Description |
|---|---|
x.bin | Enables binning for the x-axis field (divides data into intervals). |
y.aggregate | Uses "count" to show frequency in each bin. |
mark | Use "bar" to render the bins. |
tooltip | Shows bin range and frequency on hover. |
axis.title | Customizes axis labels. |
autosize | Ensures the chart fits inside its container. |
view.stroke | Removes the outer chart border. |