Visualize intelligence
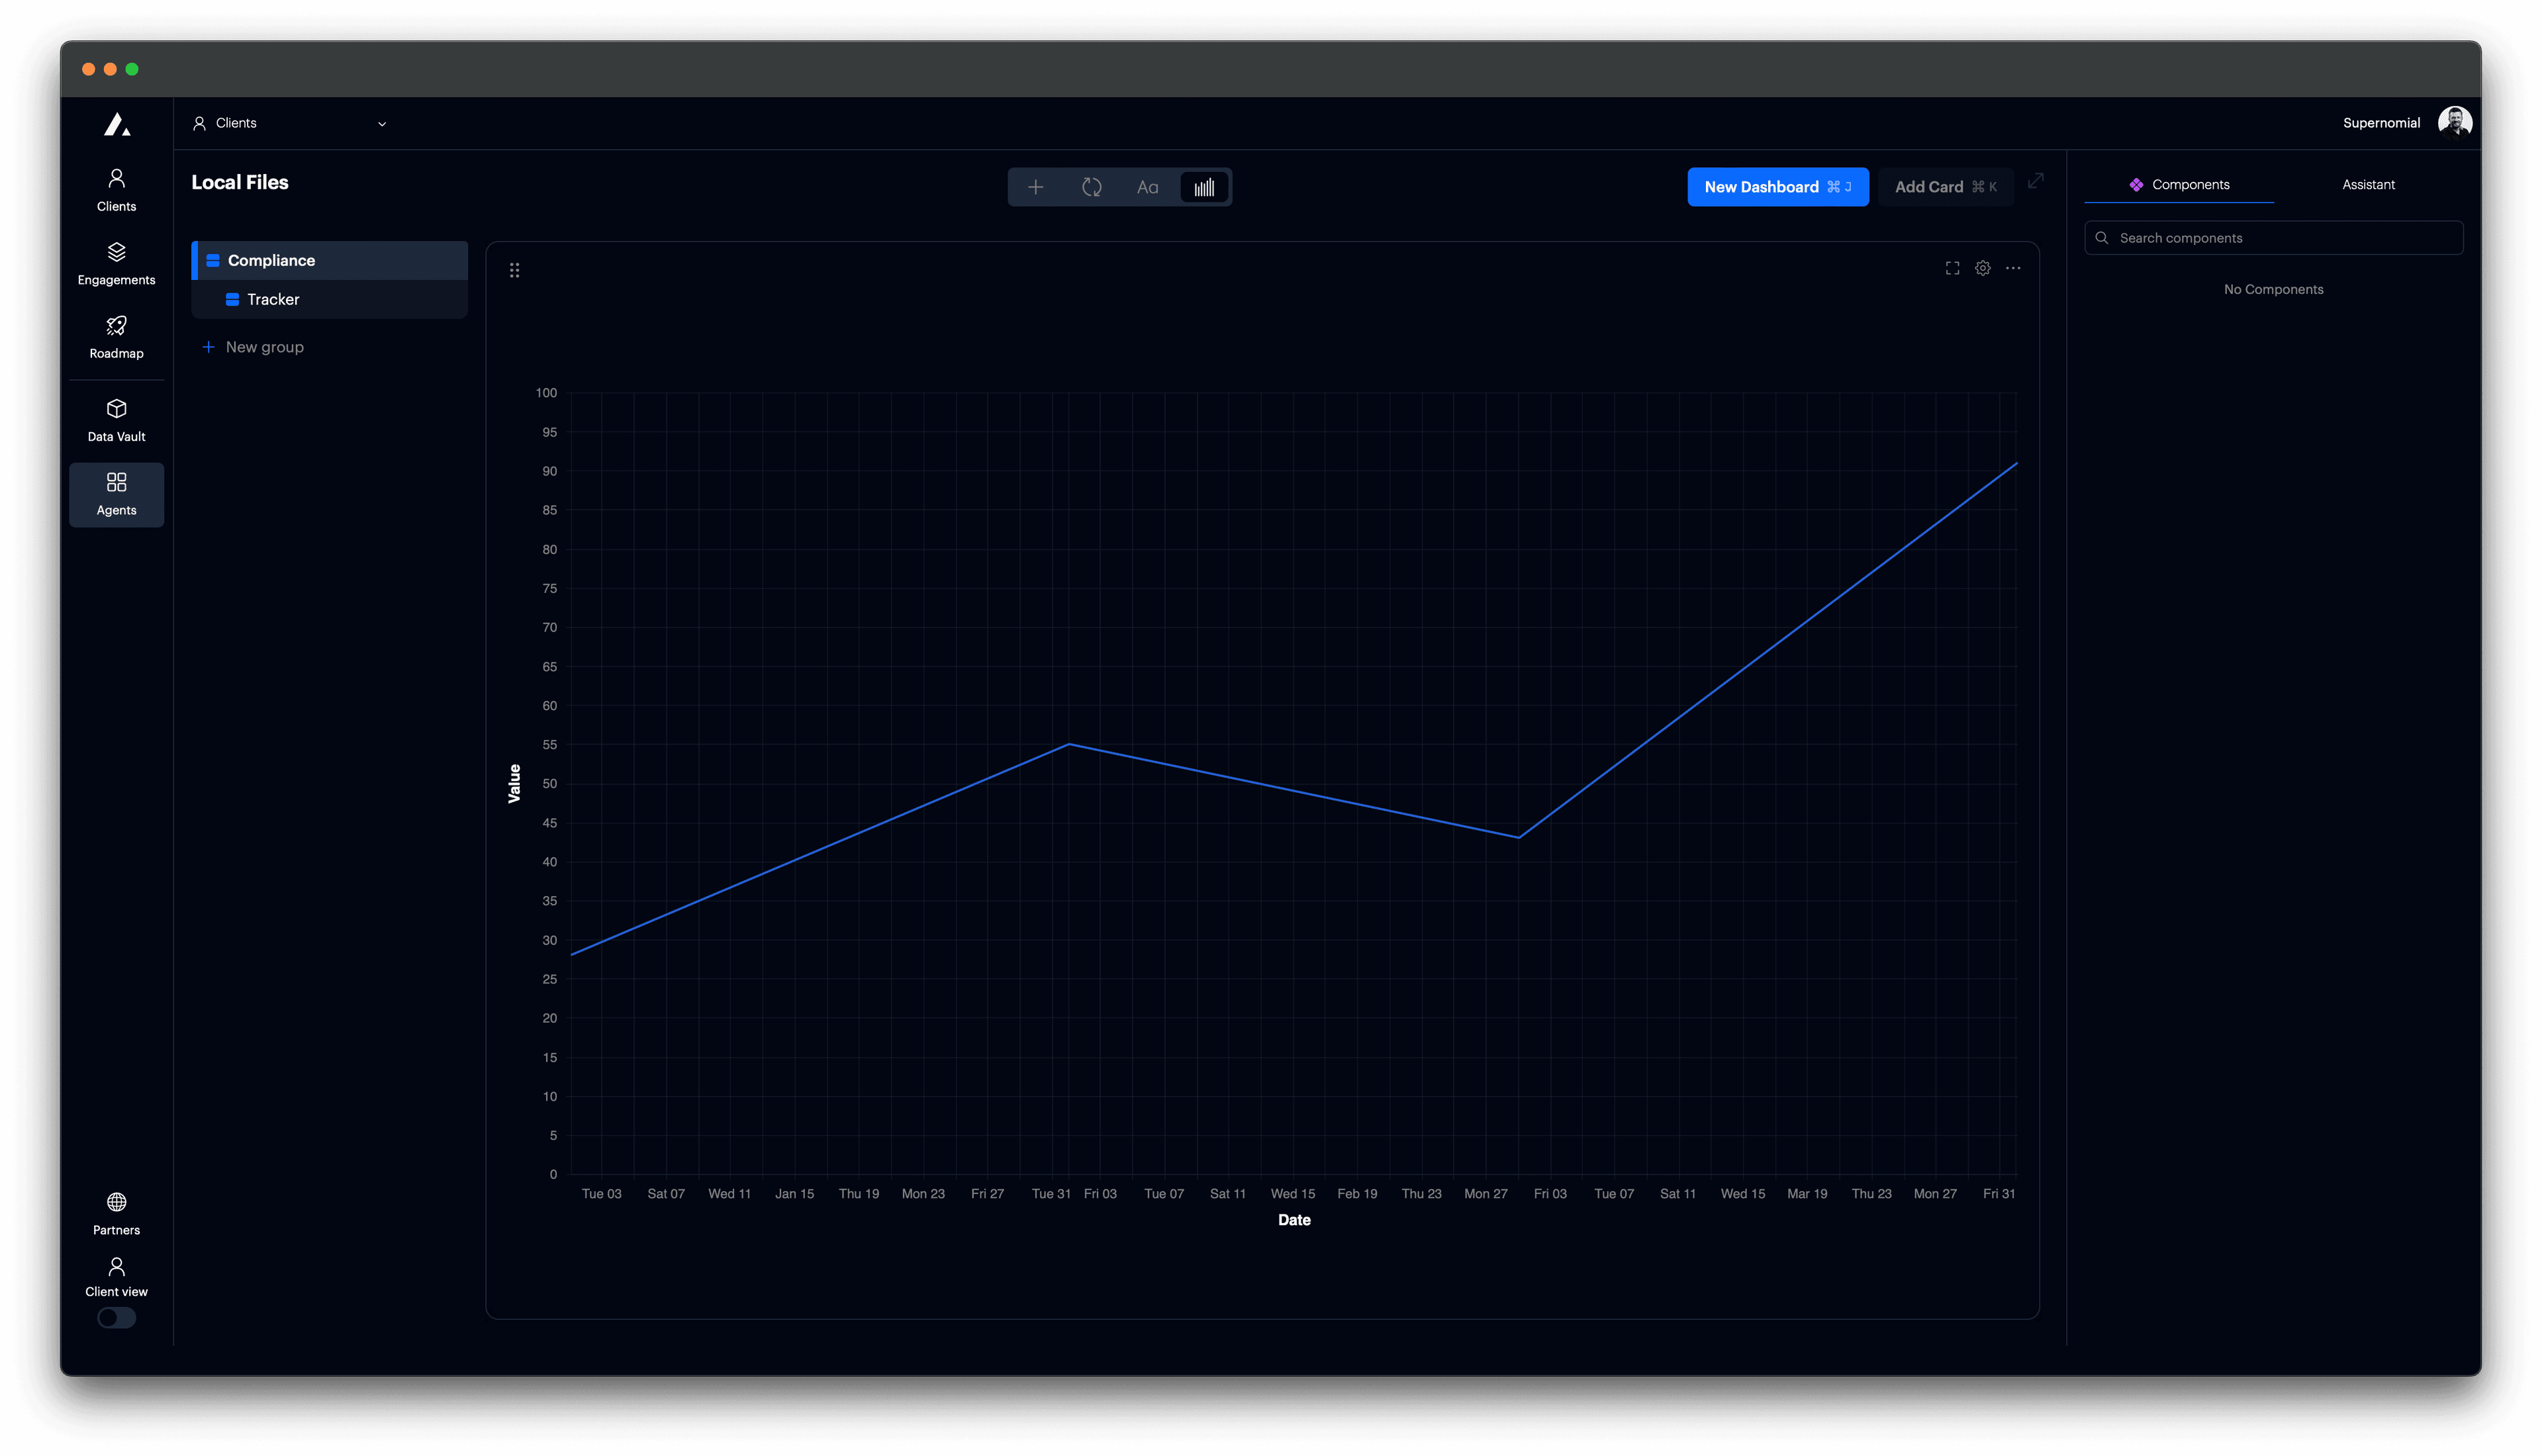
Line chart
Add a line chart to a card.
Line charts are ideal for showing how values change over time. Use them to highlight trends across dates, steps, or any continuous scale.
Add line chart
Set card to type "Vega Chart".

t0 Prompt
Select data in the context dropdown of the chat window.
make a line chart
plot trend over time
convert to line chart
Code
Configuration options
| Property | Description |
|---|---|
x | Horizontal axis. Use temporal for date or time fields. |
y | Vertical axis. Use quantitative for numeric values. |
mark | Set to "line" to draw a path connecting points. |
tooltip | Shows values on hover. |
interpolate | (Optional) Controls curve smoothing (e.g. "monotone", "step"). |
view.stroke | Removes outer chart stroke. |
autosize | Ensures the chart fits inside its container. |