Visualize intelligence
Heatmap
Add a heatmap to a card.
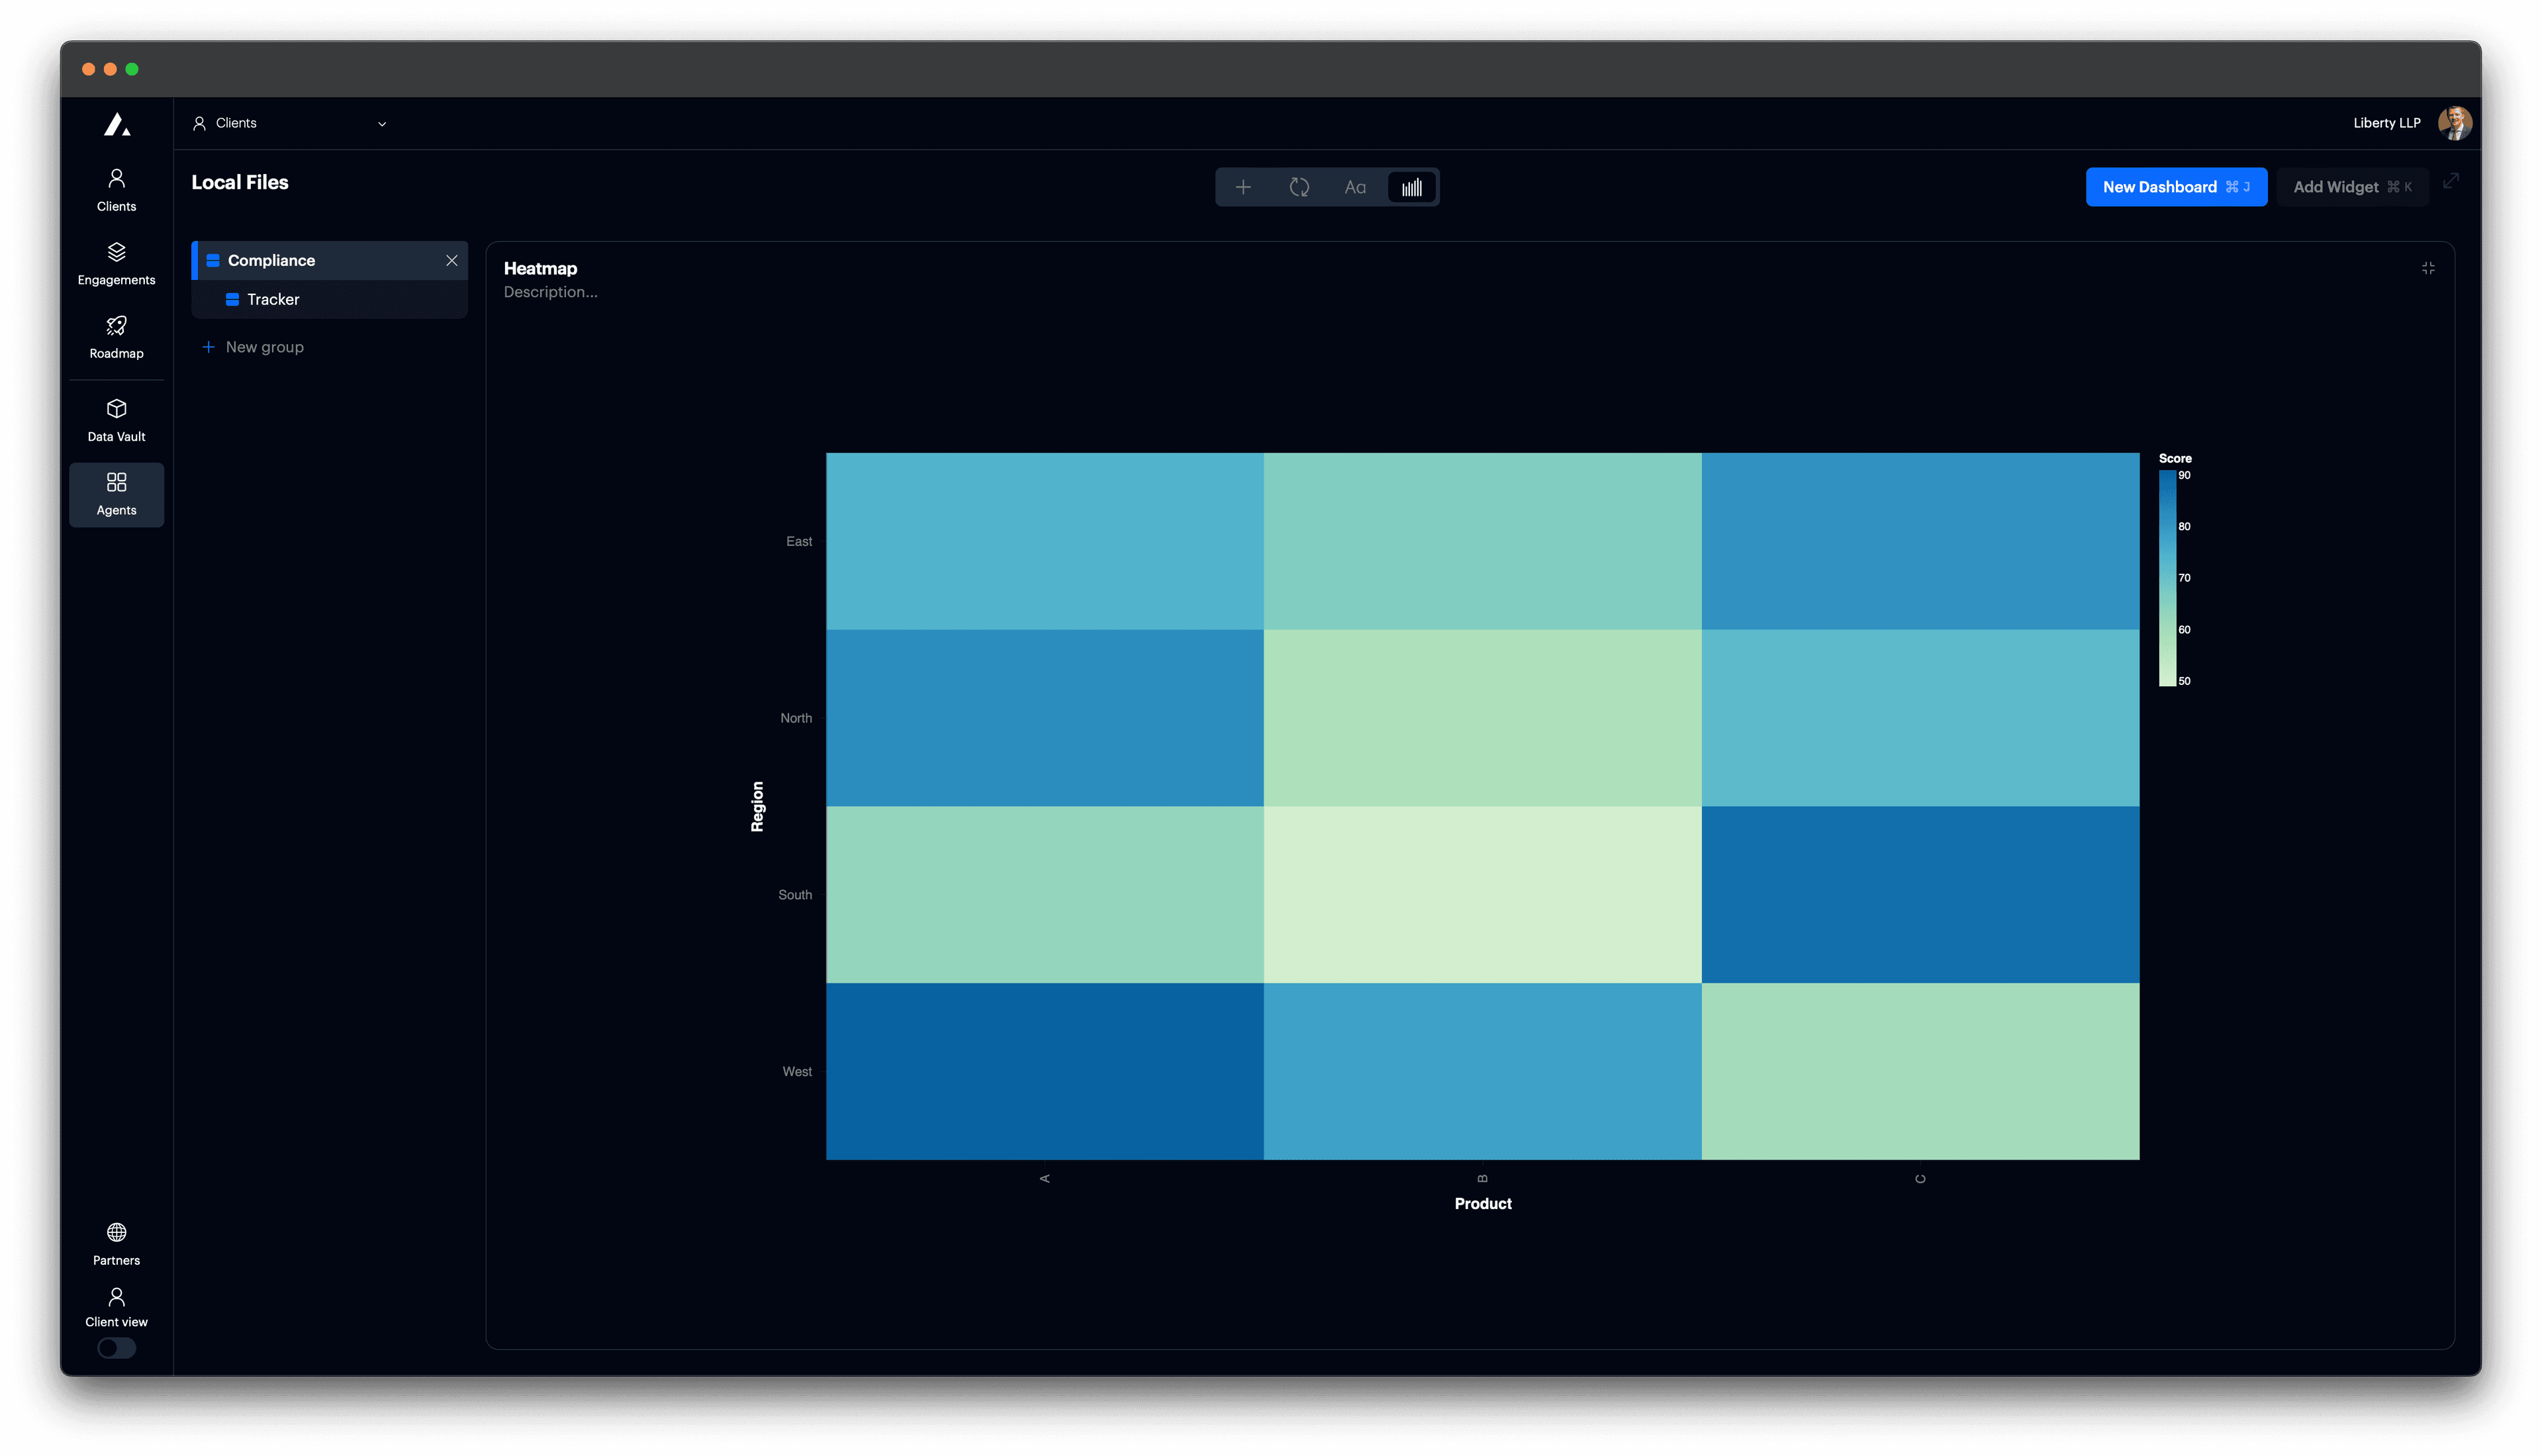
Heatmaps are useful for visualizing the magnitude of values across two categorical or time-based dimensions. Use them to identify hotspots, trends, and anomalies in dense grids.
Add heatmap
Set card to type "Vega Chart".

t0 Prompt
Select data in the context dropdown of the chat window.
make a heatmap
show value by row and column
convert to heatmap
Code
Configuration options
| Property | Description |
|---|---|
mark | Use "rect" to draw the grid cells. |
x | Horizontal axis, typically a category or time bucket. |
y | Vertical axis, typically another category or segment. |
color | Encodes the value by intensity (requires quantitative data). |
scale.scheme | Controls the color palette (e.g., "greenblue", "blues", "reds"). |
tooltip | Displays all dimension and value fields on hover. |
autosize | Ensures the chart fits inside its container. |
view.stroke | Removes outer border for a cleaner grid look. |