Visualize intelligence
Bar chart
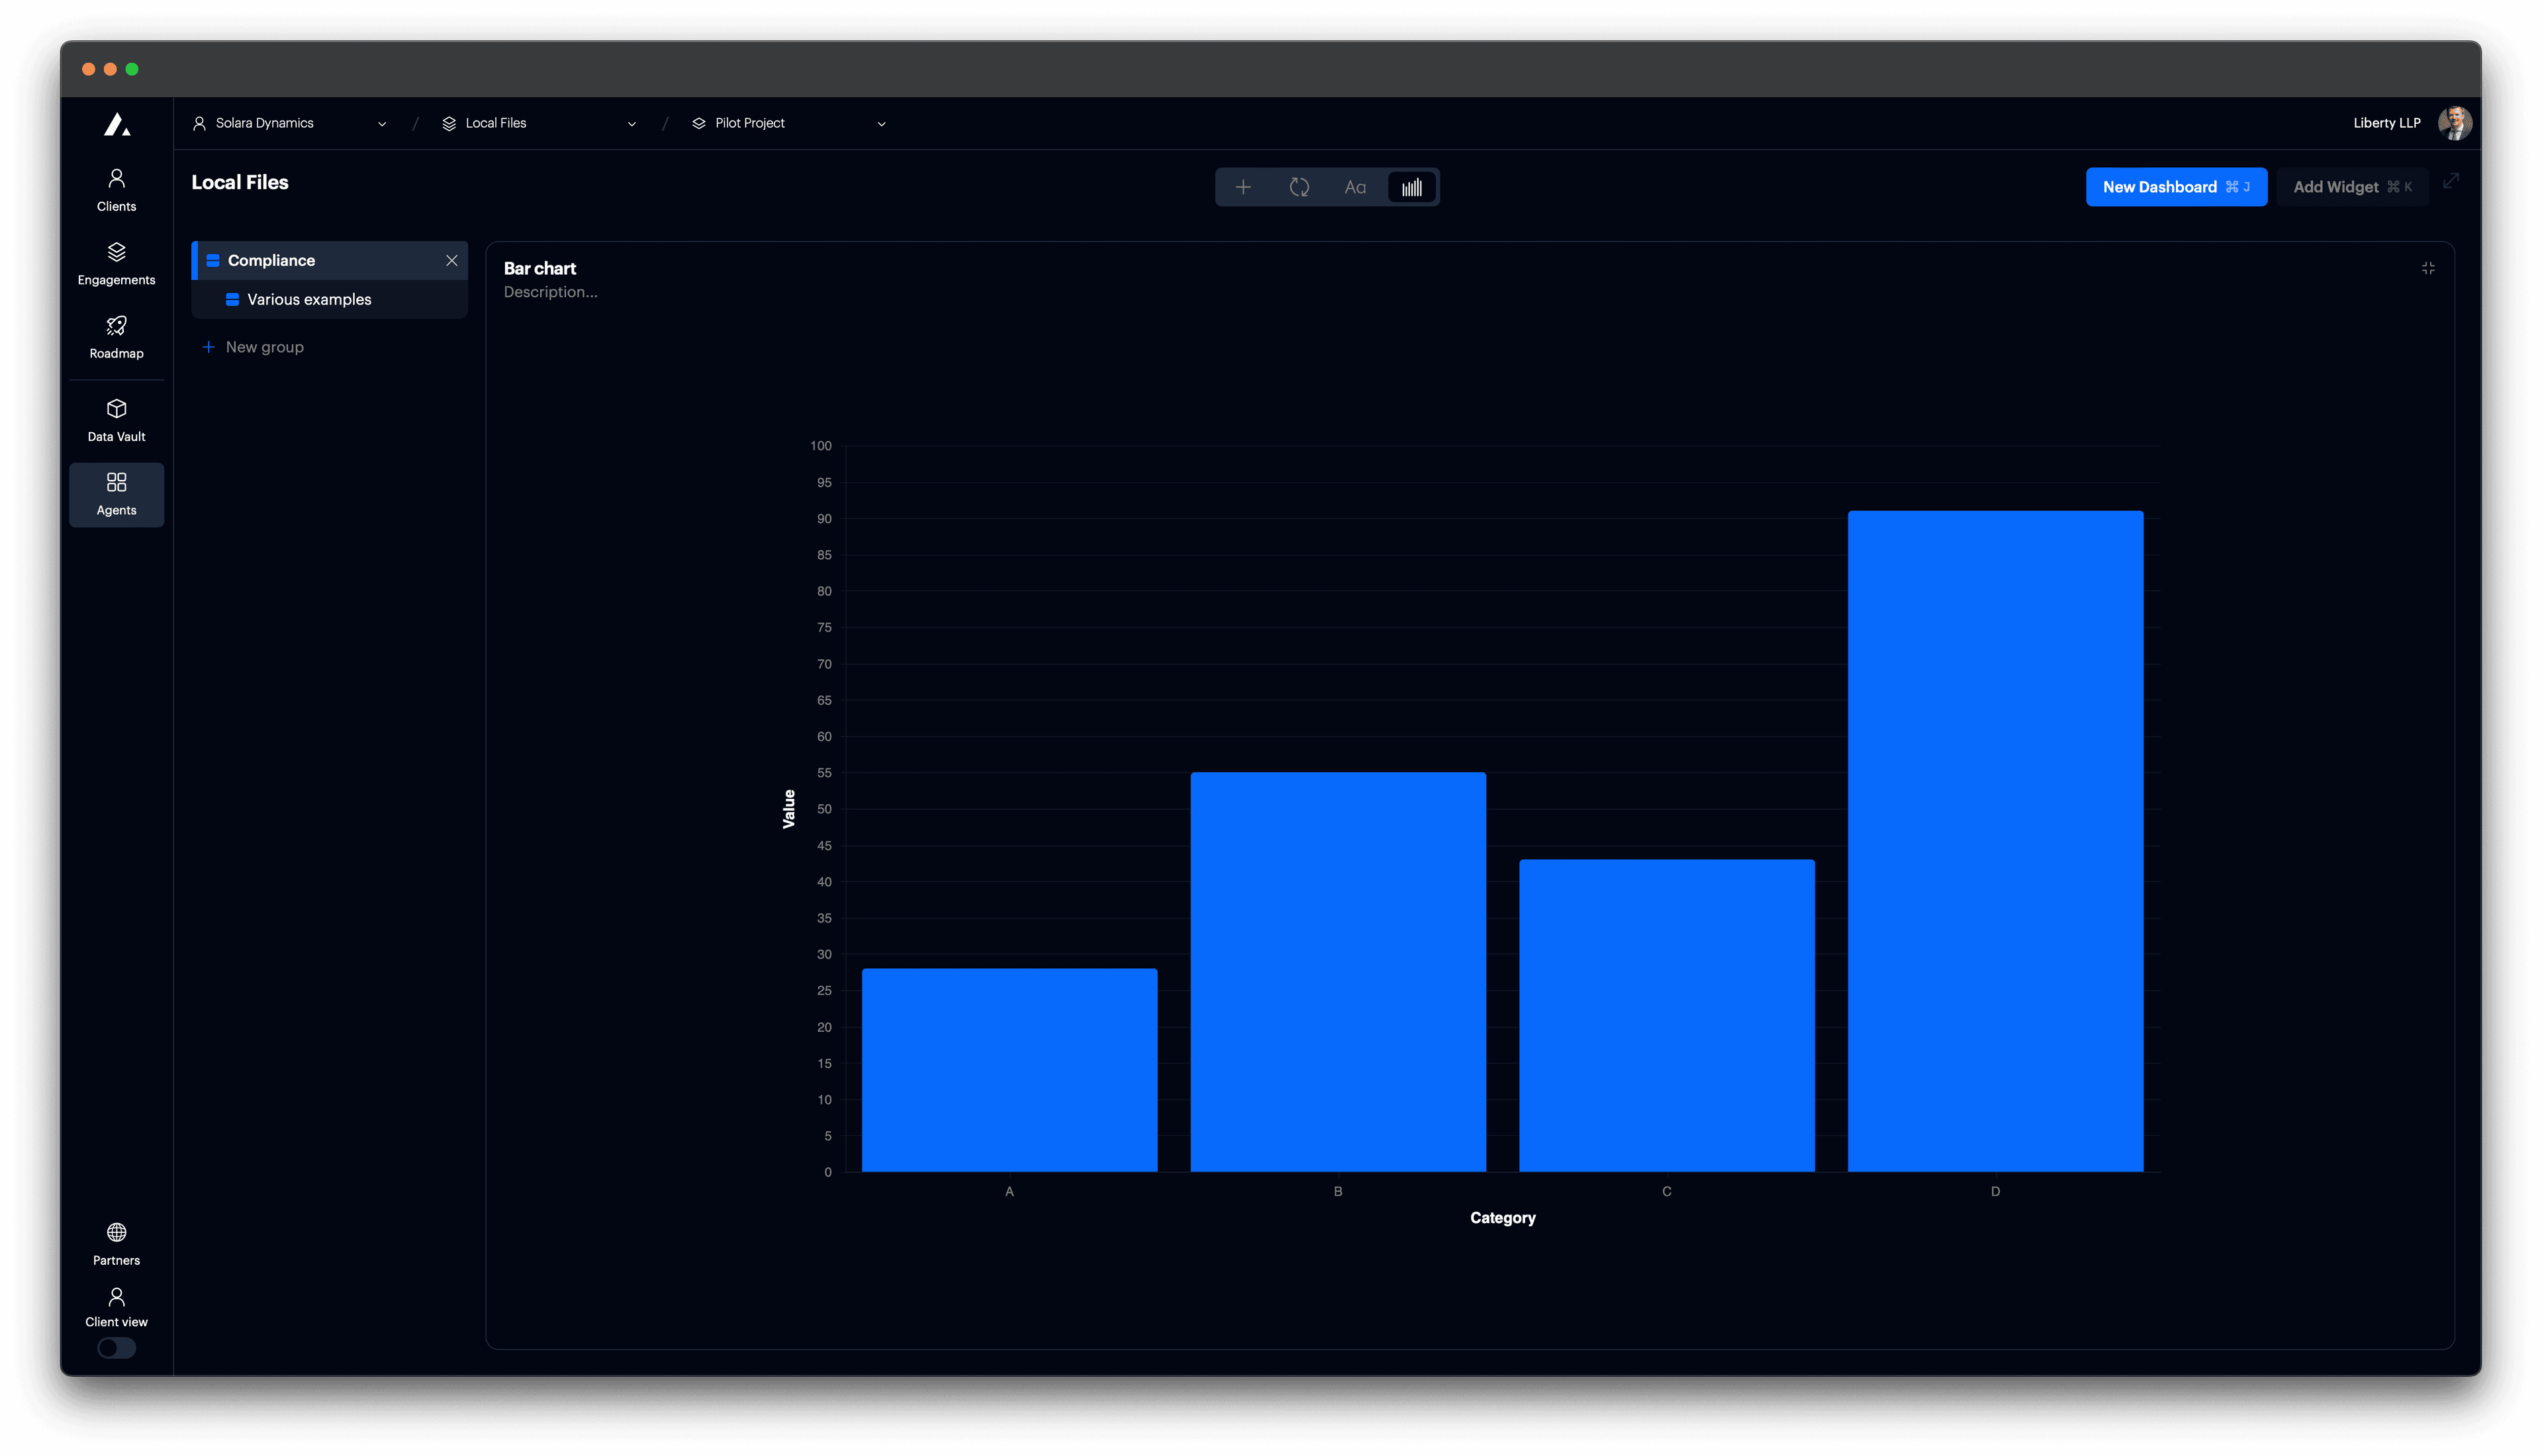
Add a vertical or horizontal bar chart to a card.
Bar charts are effective for comparing quantities across categories. Use them when you want to highlight differences in values with clear visual contrast.
Add bar chart
Set card to type "Vega Chart".

t0 Prompt
Select data in the context dropdown of the chat window.
make a bar chart
create vertical bars
convert to bar chart
Code
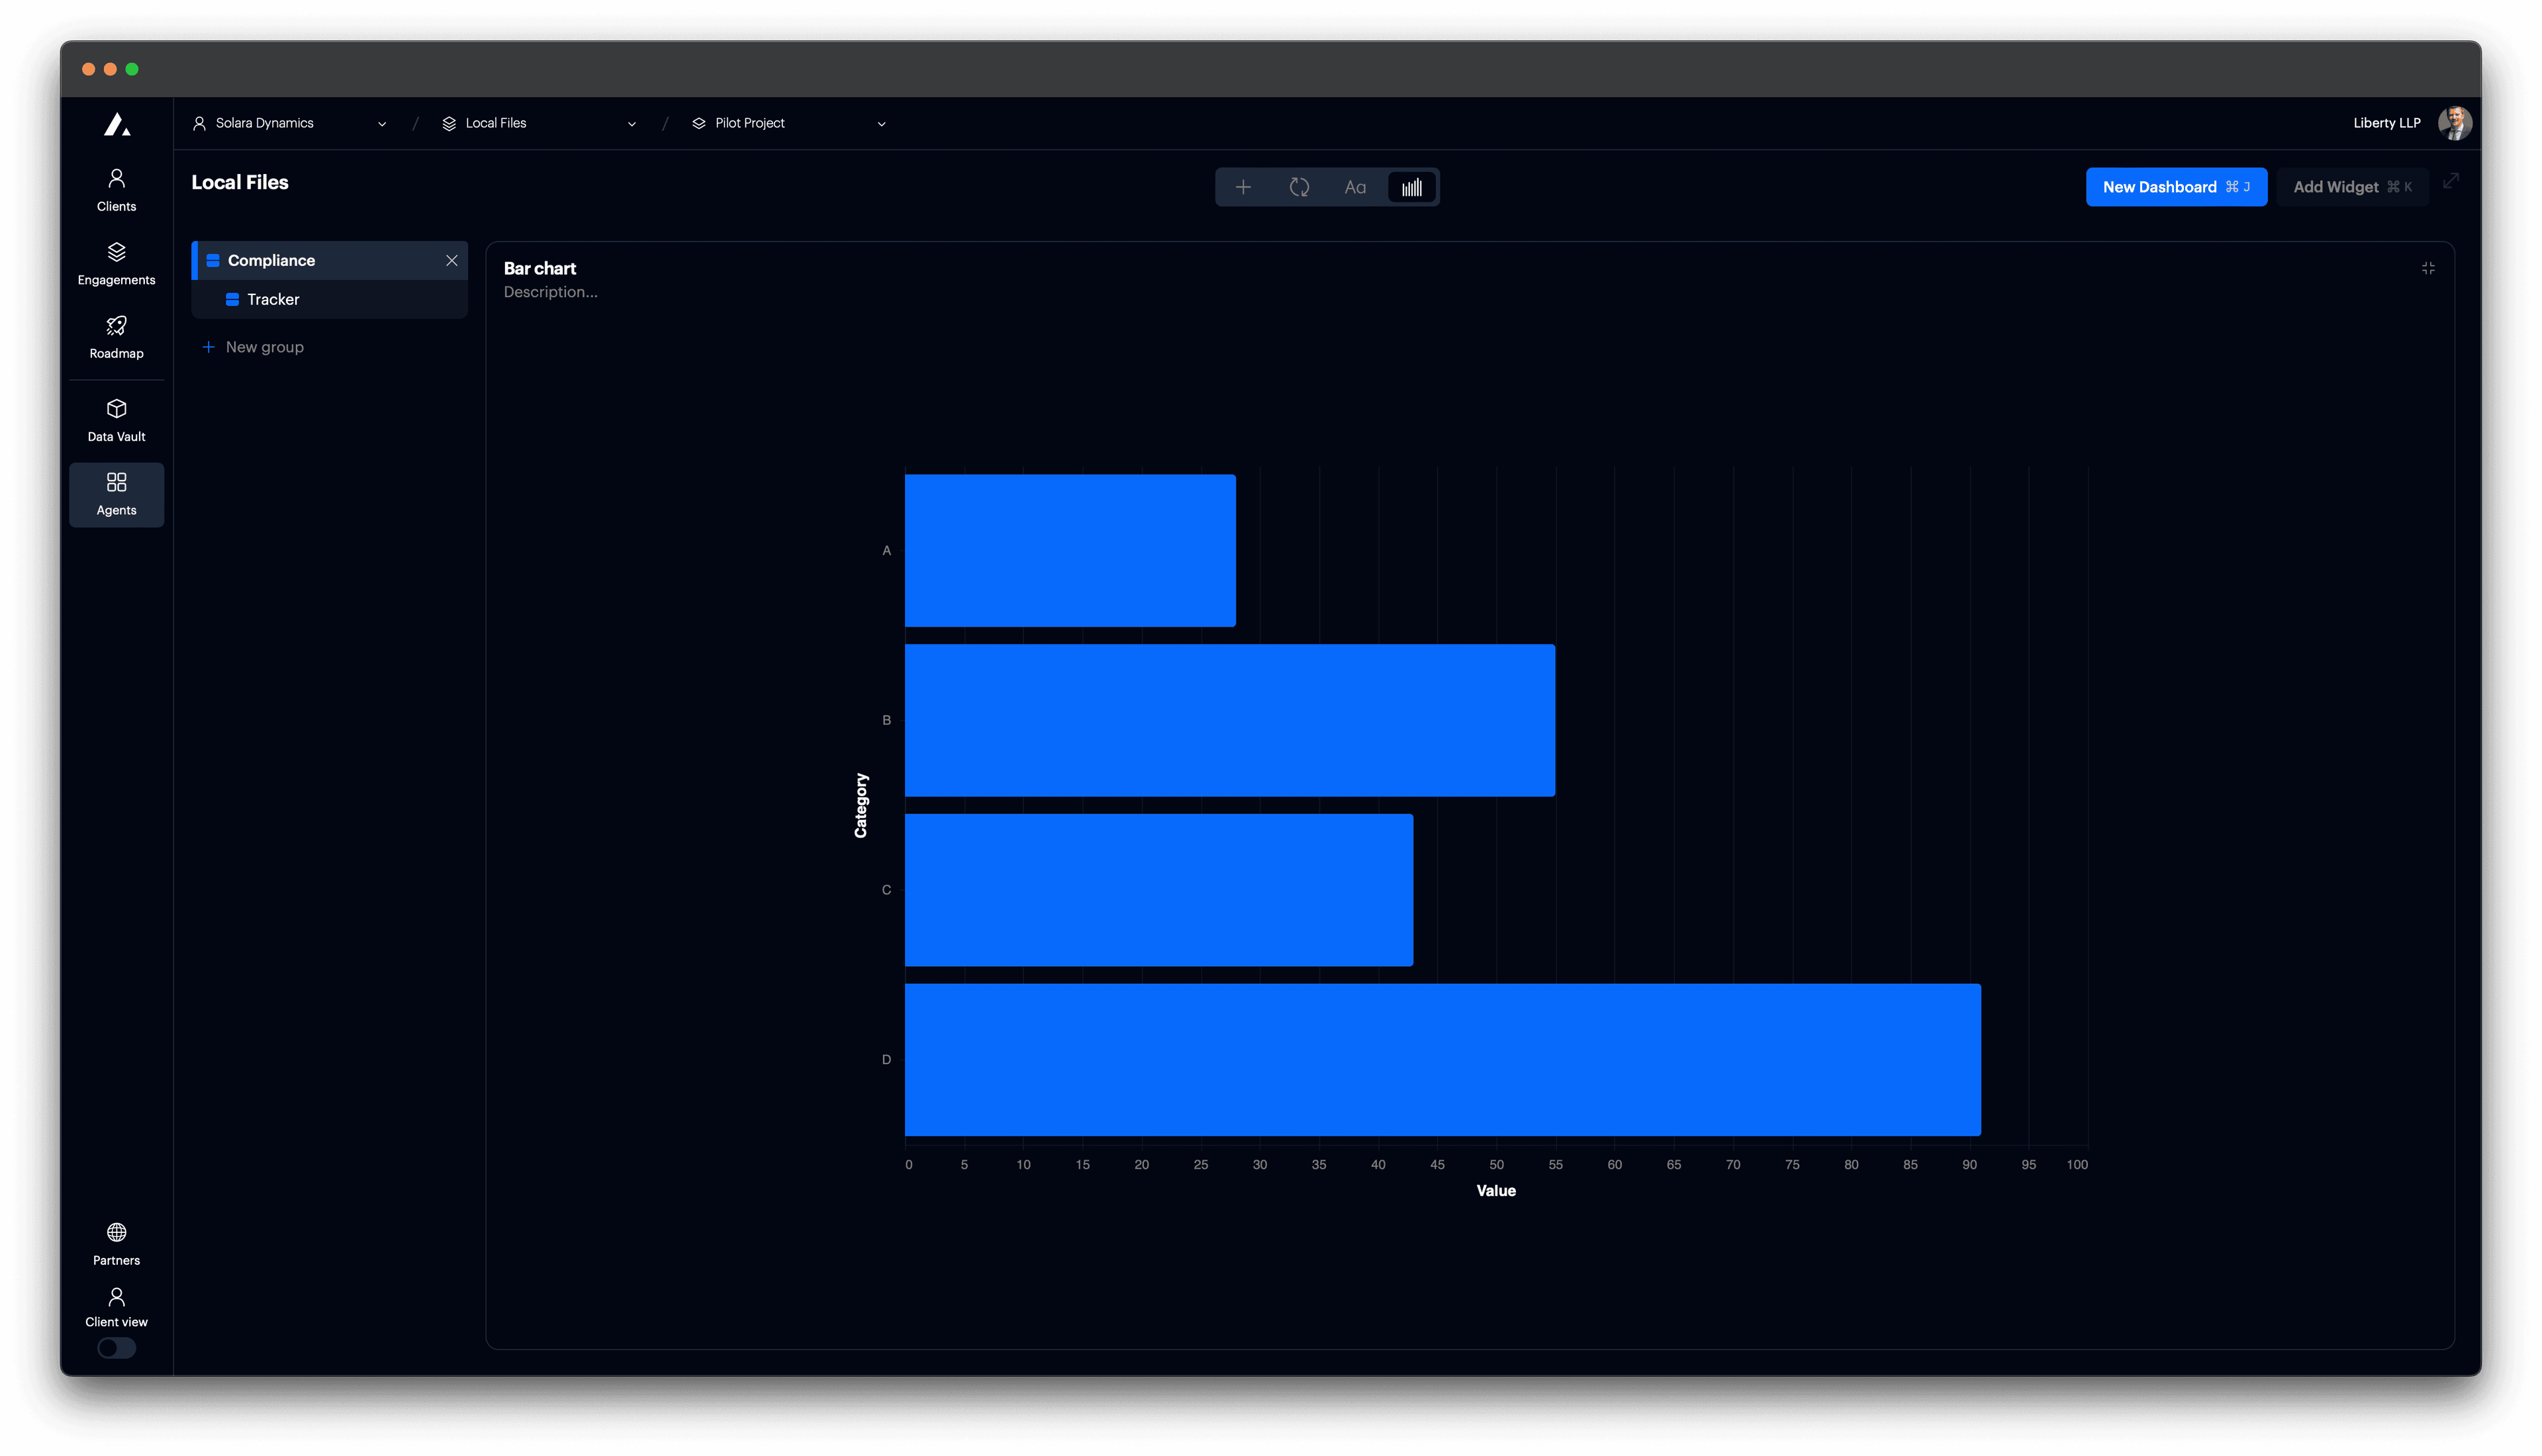
Add horizontal bar chart
Use a horizontal bar chart when category labels are long or when it’s easier to scan values side to side.
t0 Prompt
make a horizontal bar chart
flip to horizontal
Code
Configuration options
| Property | Description |
|---|---|
x | Sets horizontal axis — typically for quantitative values (for vertical bars). |
y | Sets vertical axis — typically for categorical values (for vertical bars). |
tooltip | Shows values on hover. |
mark | Use "bar" to render rectangular bars. |
axis.labelAngle | Adjusts angle of axis labels. Use 0 for horizontal labels. |
view.stroke | Removes outer chart stroke. |
autosize | Ensures the chart fits inside its container. |